This is Santa Barbara's electrical page, built from Santa Barbara's own numbers: Census housing figures, the metro's ZIP codes and its NOAA climate record. VoltReach USA routes your call to an independent local electrician; the homework below is here so you know your home's likely problems before you ever make it.
24
ZIP codes covered
1
County in the metro
148,960
Households (Census ACS)
1974
Median year home built
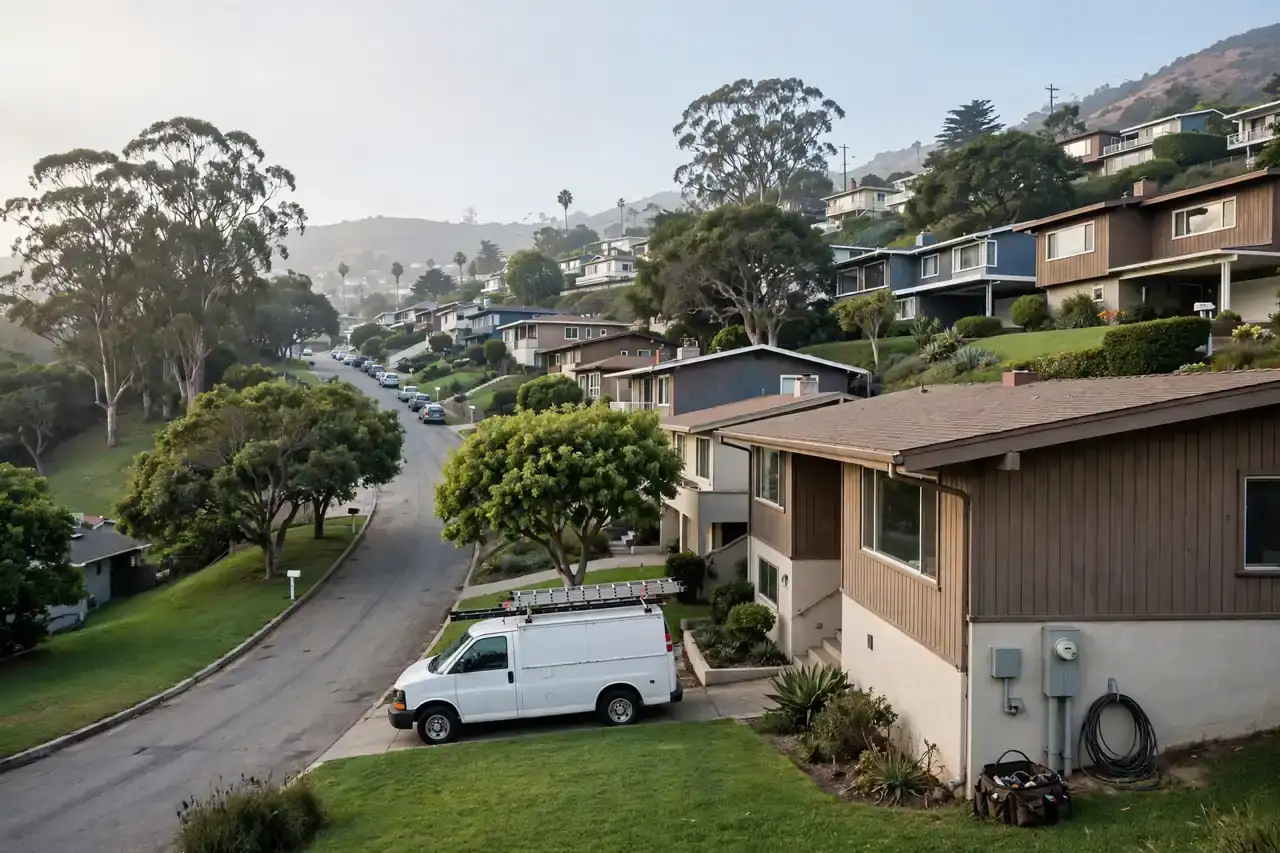
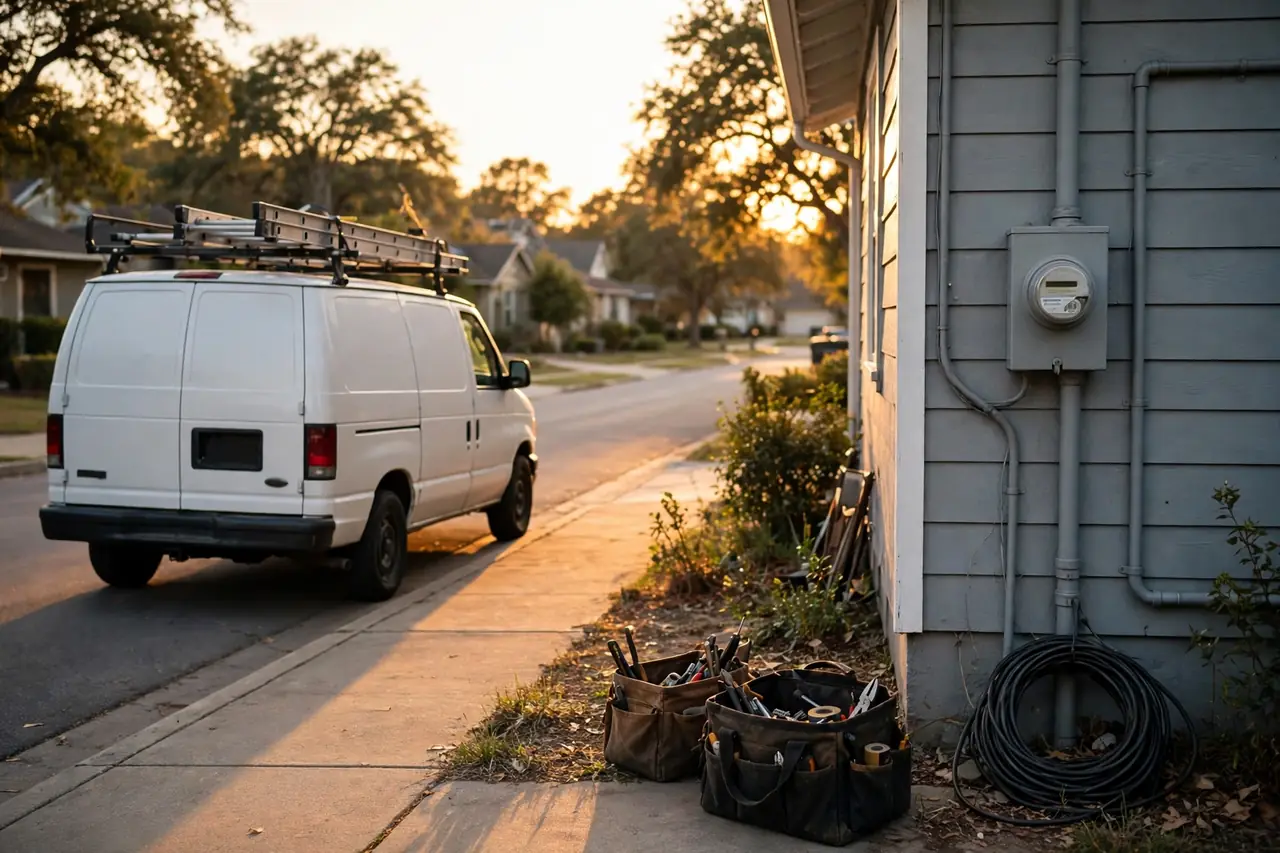
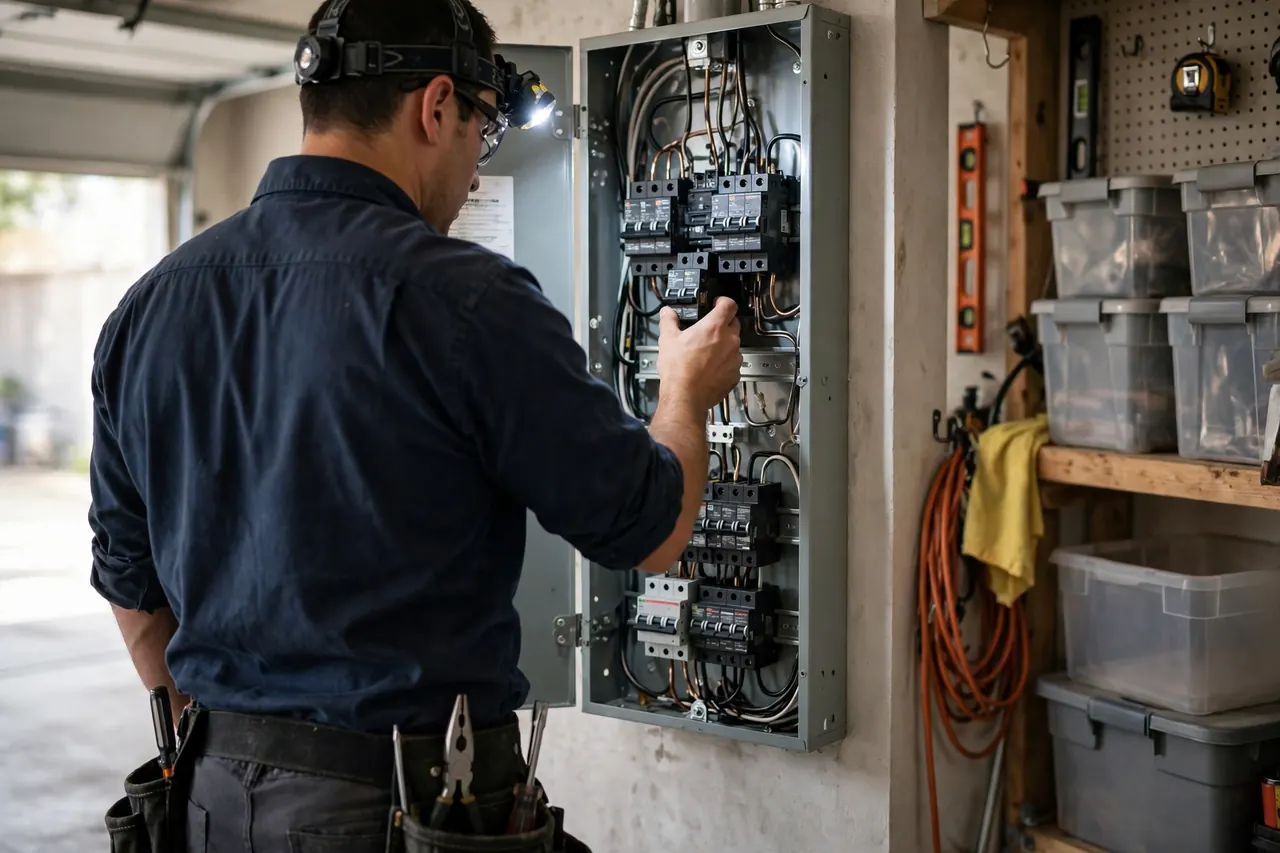
Santa Barbara, CA — electrical help across the metroA service van between calls in Santa BarbaraPanel work across the metro
Santa Barbara electrical work, in brief
The median Santa Barbara home was built in 1974; 60.8% of the stock predates 1980, and the pattern this metro's own data ranks first is aluminum wiring in santa barbara homes. VoltReach USA is a referral service, not an electrical company: one call connects you with an independent local electrician serving your ZIP code.
The Santa Barbara housing stock, and what it means for wiring
Two numbers frame everything that follows: 52.9% of Santa Barbara homes are owner-occupied, and the median one was built in 1974. Ownership matters to electrical systems because owners inherit them whole — every decision a builder made in the 1970s or earlier is still behind the walls, ageing on its original schedule. With 60.8% of homes predating 1980 and 14.5% arriving since 2000, the metro is really two housing stocks sharing one map, and they are taken separately below before the problems are ranked.
There is a wiring timeline buried in Santa Barbara's housing figures, and it reads like an electrician's diary. The 37,385 homes from before 1960 carry the oldest generations — knob-and-tube in the survivors, cloth insulation, fuse boxes in a few. The 59,752 that followed between 1960 and 1979 mixed copper with the aluminum branch-wiring years. Then came the 39,462 homes of 1980-1999, wired in copper with breaker panels as standard. Each band of that timeline is now a band of characteristic failures, arriving in the order the materials tire — which is why a home's build year, in this metro, is the single most predictive fact about its electrical system.
Uniformity is the newer stock's defining trait. A subdivision in Santa Barbara or Lompoc went up in a handful of years, fitted with one generation of panels, one approach to circuit layouts, one set of devices. That uniformity writes a calendar the whole street shares: the first GFCI failures, the first breaker replacements and the first EV-charger capacity questions arrive together, years before the same streets need anything structural. With 14.5% of the metro built since 2000, that calendar governs a large and growing share of Santa Barbara's electrical work — predictable work, if a household reads the calendar early.
The climate written over all of it comes from the NOAA station at SANTA BARBARA 11 W, CA US: an average year brings 2,498 heating degree days, 108 cooling degree days and 18.98 inches of precipitation. Those are not abstractions to a panel or a circuit — they set how hard heating and cooling equipment loads the system in January and July alike, how often storm seasons test the grid connection, and whether a space heater on an old circuit is a worry or a certainty. The problem sections that follow are selected by exactly these numbers, combined with the housing-age profile above.
The Santa Barbara electrical profile in numbers
The metro's building eras on one side, its weather record on the other — and its wiring where the two meet.
The distribution, in one breath: of every hundred Santa Barbara homes, 23.4 were standing before 1960, 37.4 went up in the two decades after, 24.7 in the two after that, and 14.5 have arrived since 2000. Percentages flatten the picture, so hold the counts beside them — 37,385 oldest-era homes, 23,166 newest — and the metro's electrical systems stop being an abstraction: that many panels, that many wiring generations, ageing in that order.
Housing in Santa Barbara is dominated by the 1960 to 1979 decades, 37.4 of the stock and 59,752 homes, around a median year of 1974. That period brought early breaker panels rather than fuses, the aluminium branch-wiring years in part of the stock, and many homes built with ungrounded or partially grounded outlets by current expectations. Panel capacities were modest and circuit counts low compared with present use in Santa Maria, Santa Barbara and Lompoc. For Santa Barbara, California, the electrical story is a mid-century system, now fifty or more years old in Santa Barbara, carrying twenty-first-century loads it was never sized to serve. It also explains why connection condition, breaker availability for older panel lines and honest capacity discussions dominate assessments in streets built during those decades.
As runner-up era, the 1980 to 1999 band brings a measure of modernity to Santa Barbara beyond its dominant stock. Homes of this period in Santa Barbara, Lompoc and Goleta generally offer grounded circuits, recognisable panel layouts and wiring that independent local electricians in Santa Barbara can extend and adapt readily. Their age still tells, in breakers and devices that have served for decades in Santa Barbara, California, so the local theme for this band is refresh rather than replacement: testing what is present, renewing worn components and confirming capacity before new loads such as vehicle charging are added.
Taken together, the numbers at SANTA BARBARA 11 W, CA US describe a metro where electrical systems in Santa Barbara work hard and rest little: 2,498 heating degree days in the cold season, 108 cooling degree days in the hot season, 1.3 freezing days, 1.0 hot days, 58.4 on average and 18.98 of precipitation delivered partly as storms. For the 159,766 housing units across 1 counties, that means load, heat, moisture and surge exposure acting on the housing eras described above, all at once. Independent local electricians serving Santa Barbara, California read a home's condition against that combined climate background in Santa Barbara, not against a mild-weather snapshot. Read alongside the housing eras, these figures complete a practical map that helps owners understand their own home as part of a wider local pattern.
This ranking is where the two halves of the profile meet in Santa Barbara. Housing era alone does not decide a home's electrical condition, and climate alone does not either; it is their overlap, an older panel in Santa Maria carrying peak summer load, or a mid-century circuit in Santa Barbara serving space heaters through freeze nights in Santa Barbara, that produces the findings homeowners actually face. Independent local electricians can place a specific Santa Barbara, California home within this ranking and explain, from its era and its exposure, what deserves attention first.
Electrical problems Santa Barbara homes actually get
Selected and ranked from this metro's housing-age profile and climate record — not copied from another city's page.
Aluminum Wiring in Santa Barbara Homes
Buying and selling often brings this topic forward in Santa Barbara, and it helps to keep it in proportion. A home inspection may note aluminum branch wiring in a 1960s or 1970s house in Lompoc or Orcutt, and the note can sound more alarming than the underlying finding. The useful next step for either side is documentation: has the wiring been assessed, were connections remediated with listed methods, and is there a record of that work? VoltReach USA connects Santa Barbara homeowners with independent local electricians who can inspect and explain, giving a transaction a factual basis. Clear documentation serves the current owner as much as the next one, whatever the timing of any sale.
Mixed wiring deserves a mention in Santa Barbara, because few houses of this age are untouched. A 1970s addition in Santa Barbara may be copper, a replaced circuit in the kitchen may be copper, and the original bedrooms may remain aluminum, all meeting in the same panel. Problems arise when the two metals are joined casually in a box with a connector meant only for copper. An electrician mapping a house will note where transitions happen and whether each one uses a connector listed for that pairing. That map, once made, guides any remediation in a sensible order, starting with connections showing heat or looseness.
Nothing about this pattern asks a Santa Barbara homeowner to panic, and this page will not pretend otherwise. Many homes with aluminum branch wiring have given ordinary service for decades, and many have already had their connections addressed during past renovations or device replacements. The concern is narrower and well understood: connections made or remade over the years with devices or connectors not rated for aluminum can deteriorate quietly inside boxes. Because the deterioration is hidden, the sensible response in Santa Barbara is not worry and not dismissal, but a professional look at a sample of outlets, switches and junctions to establish what is actually installed.
Electric heating loads differ from most household loads in one crucial way in Santa Barbara: duration. A kettle boils and stops; a heating system on a January night runs for hours at full draw, and its auxiliary strips, when called, add a second large load on top of the heat pump itself. Circuits, breakers and connections sized or aged without that duration in mind heat steadily. Breakers protecting heating circuits may trip as protection should, and equipment may shut down on its own safety controls. When heating fails on the coldest night in a Santa Barbara home, the electrical supply to that equipment is one of the first places an electrician looks, alongside the equipment itself.
If heating trips a breaker repeatedly in a Santa Barbara home, treat the pattern carefully. Resetting once and watching is reasonable for many households. Repeated trips, a breaker that will not hold, warmth or smell at the panel, or discoloration at the heating disconnect are signs to stop resetting and call an electrician, because a breaker that keeps tripping under a sustained heating load is reporting a condition that resetting cannot fix. Keep the house as warm as the remaining system allows, use any heater you do run on a circuit of its own and attended, and give the electrician in Santa Barbara the timeline of trips and temperatures when you call.
The timing pattern is the telling evidence in Santa Barbara. Electrical failures here cluster in deep winter, often on the same few nights when the whole region is coldest. That is not coincidence; it is arithmetic under stress. A heat pump in Goleta that coped all autumn switches to auxiliary heat as temperatures fall, multiplying its draw. Space heaters appear in bedrooms in Orcutt on circuits that were quiet all summer. Every house on the street makes the same moves at once. Electricians serving Santa Barbara plan for those nights, because they know marginal panels and tired connections in Santa Barbara reveal themselves exactly when heating demand peaks and alternatives are fewest.
Start with what a panel upgrade conversation actually involves in California. An electrician looks at the service size entering the home, the panel capacity, the condition of breakers and bus work, grounding and bonding, and how circuits are distributed across the rooms they serve. In Santa Barbara homes from the 1970s, that assessment often finds a panel that is full, circuits that have been doubled up over the years, and no practical path to add a major appliance. A proper upgrade addresses the service as a system, matched to a calculated load for the house as it is used now, with room to work safely rather than a patch on one overloaded branch.
Grounding and bonding deserve attention alongside capacity in older Santa Barbara homes. As services are upgraded or altered over decades, grounding arrangements from different eras can end up mixed together, and later work may assume a grounding path that was never completed. An electrician assessing an ageing panel will typically check the grounding electrode system, bonding of metal piping where required, and the separation and arrangement inside the panel. These details rarely show symptoms a homeowner can see, which is precisely why they belong in a professional assessment rather than being judged from the condition of the cover or the neatness of the wiring.
Drive through older streets in Santa Barbara and the pattern is visible from the sidewalk: smaller service masts, meter bases from another era, and panels tucked in closets, garages and laundry rooms in Santa Maria and Goleta. With 37,385 homes dating before 1960 — 23.4 of homes here — a share of Santa Barbara housing still relies on equipment installed decades before modern loads existed. The panel has not failed in any dramatic way. It has simply been asked, year after year, to carry a house that uses electricity very differently from the house it was built for.
Watch for
Double tapped breakers visible on inspection
Rust or corrosion on the panel enclosure
Appliances that cannot run at the same time
Frequent trips on hot afternoons in {city}
Old panel brands flagged by your electrician for assessment
Home sale inspection notes raising panel questions
The grounding gap matters for modern life in a Santa Barbara home, and it is worth explaining plainly. Many current appliances, electronics and surge protection devices are designed around a grounded outlet. Fitting three prong receptacles onto an ungrounded system without addressing the underlying wiring can create the appearance of grounding where none exists, which helps no one. There are recognised approaches for improving safety on older circuits, and an electrician can explain which apply in Santa Barbara, but the durable solution for heavily used circuits is usually rewiring them to modern standards. In the oldest parts of Santa Barbara, that rewiring is often planned room by room alongside other renovation, spreading the disruption sensibly.
It is also worth sepacapacity active from abandoned wiring in Santa Barbara homes. Many older houses contain stretches of knob-and-tube that were disconnected during past updates and left in place, which is common and not itself a live concern. From the outside, abandoned and active runs can look identical, which is why assumptions in either direction mislead. An electrician tests and traces to confirm which runs still carry current and which are dead remnants. Sellers in Santa Barbara and Goleta sometimes discover their alarming attic wiring is long disconnected, while buyers occasionally learn the opposite. Either way, verified status is what makes the finding useful rather than merely worrying.
Insurance and renovation conversations are where many Santa Barbara homeowners first hear this term in a serious tone. An insurer, a home inspector or a renovation contractor in California may ask whether knob-and-tube is present and active, and the homeowner may genuinely not know, because it hides above ceilings and behind plaster in Santa Barbara and Orcutt. This page makes no claim about any particular policy or rule, which vary and change. It makes a simpler point: knowing, with documentation, what wiring a Santa Barbara home actually contains is useful in every one of those conversations, and an electrician's assessment is how that knowledge is obtained.
Wet season is also the honest audit of a Santa Barbara home's exterior electrical condition. Outlet covers that no longer close, a panel in a garage wall that takes driven rain in Orcutt, exterior lights that fill with water, pumps and pool equipment working through the rainiest months — the season tests each one in turn. Homeowners in Santa Barbara can use a dry day mid season to walk the property and note what the rain has shown: which outdoor outlets trip, where water stands near electrical equipment, any rust blooming on enclosures. Sharing that walk's findings with an electrician turns a vague report of wet weather faults in California into a targeted inspection list, and the repairs that follow usually serve for many wet seasons afterward.
The wet season in Santa Barbara is a season of small electrical warnings. With 18.98 of precipitation recorded at SANTA BARBARA 11 W, CA US, moisture reaches exterior outlets, garage circuits and older fittings across Santa Maria, Santa Barbara and Lompoc, ground-fault protection trips more often, corrosion progresses on exposed connections and storm activity raises surge exposure. A ground-fault trip in wet weather is protection working, and repeated trips deserve investigation rather than repeated resets. Independent local electricians can test protected circuits in Santa Barbara, California homes, check exterior fittings and seals in Santa Barbara, and advise where protection should be added or renewed.
A closer look: aluminum wiring in santa barbara homes in Santa Barbara
Context from the building era adds another layer for Santa Barbara. Aluminum branch wiring arrived during a period of copper shortages, and it was installed across the country in otherwise ordinary, well built homes — the 59,752 homes counted in Santa Barbara include plenty of solid housing in Santa Maria and Santa Barbara. The wiring was an industry response to material economics, not a shortcut by a single builder, and the homes themselves often have much to recommend them. That context matters for tone. Owning one of these houses does not mean owning a problem house; it means owning a house with one known, specific item to have checked, in the same way a roof of a certain age is checked. Electricians who work in older Santa Barbara neighbourhoods assess these systems routinely, explain the findings without drama, and leave the homeowner with a documented picture and clear choices about connection remediation or rewiring.
Read the ranking backwards and it reads as a data summary: 443,975 residents in 159,766 housing units, 23.4% of the housing from before 1960, 18.98 inches of rain in an average year. The pattern leads because the exposure is broad — counted not in individual unlucky houses but in whole eras of the metro's building, stacked one on another.
The first visit follows a short, diagnostic list — each item ruling a branch of the problem in or out:
Confirm wiring material at panel and boxes
Sample outlets and switches across several rooms
Check device capacities for aluminum suitability
Inspect splices for connectors listed for mixed metals
Look for heat damage or discoloration at terminations
Note any circuits already remediated or rewired
Electrical services in Santa Barbara
Sequenced by this metro's own problem ranking, not by a national catalogue order.
Home Rewiring in Santa Barbara
Partial rewiring is a common path in Santa Barbara: the kitchen, laundry, and heaviest-use rooms first, the rest later. Local electricians can stage the work so a household in Lompoc improves safety and function in a planned order. Asking for that staged plan in writing helps owners compare approaches clearly and decide on timing without pressure or guesswork about the walls involved.
The map of Santa Barbara is also a map of wiring age. Older districts near Santa Maria hold the deepest stock of early housing, while growth near Santa Barbara, Lompoc and Goleta added 23,166 homes since 2000 with contemporary wiring throughout. Between them, streets built in the 1960s, 1970s and 1980s fill 1 counties with their own mix. A homeowner comparing rewiring in Santa Barbara is really comparing eras, because access, wall construction and existing circuits differ sharply by neighbourhood and decade. Independent local electricians who work across Santa Barbara can explain those differences in practical terms and help owners in California plan around occupancy and renovation timing. The mix of plaster, drywall and later additions found near Santa Maria means opening walls is planned carefully, room by room, in advance. From Santa Maria to the newer streets near Santa Barbara, the consistent advice in Santa Barbara is to understand the existing system first, and independent local electricians can provide that understanding for homes across 1 counties before any work is agreed.
The Santa Barbara climate recorded at SANTA BARBARA 11 W, CA US includes 1.3 days at or below freezing, 1.0 hot days and 18.98 of precipitation annually. Wiring in Santa Barbara attics and walls experiences those extremes every year, and insulation on older conductors ages accordingly. Independent local electricians can weigh exposure and age together when assessing rewiring priorities for a home in Santa Barbara.
Storms move through Santa Barbara, California, where annual rainfall averages 18.98 and downed lines are the utility's territory, never yours to approach. For damage on the home side, VoltReach USA connects you with an independent local electrician.
Weather produces many of the urgent calls in Santa Barbara, California. The SANTA BARBARA 11 W, CA US record of 18.98 annual precipitation, 1.0 hot days, 1.3 freezing days and sharp seasonal swings in 2,498 and 108 describes storms, heat and cold that stress overhead connections, panels and exterior equipment. A partial outage after a storm, a surge that damages appliances, or a heating system that fails on the coldest night can all feel like emergencies because, for the household, they are. Across Santa Barbara, independent local electricians can help Santa Barbara homeowners determine whether the fault lies within the home or on the utility side and respond accordingly. Households in Lompoc should know where their main disconnect is before an emergency, so help can act quickly when it arrives. Owner-occupiers, 52.9 of households in Santa Barbara, often plan electrical work alongside other projects, and independent local electricians can help sequence it sensibly for a property in Santa Barbara so walls are opened once and circuits are planned as a whole.
Urgent faults in Santa Barbara arise from a stock where 97,138 homes predate 1980 and the median build year is 1974, spread across 24 ZIP codes in 1 counties. Ageing systems meeting modern load is the recurring local pattern in Santa Barbara. Independent local electricians can make a Santa Barbara, California home safe, isolate the fault and explain the likely role of the system's age and condition.
Weather in Santa Barbara swings from 1.3 days at or below freezing to 1.0 days of real heat, so heating and cooling loads in Santa Barbara are not small. A panel sized for an earlier era can struggle when those systems run hard. A panel that can carry those peaks without strain also removes the daily guessing about which appliances can safely run at the same time together.
Safety is the reason panel work deserves a careful, unhurried assessment in Santa Barbara, California. Signs homeowners notice, from flickering under load to breakers that trip and reset repeatedly, from buzzing at the panel to discolouration around a breaker, are signals to pause and seek an evaluation rather than to keep resetting and hoping. In a metro where 37,385 homes predate 1960 and many more date to the middle decades, ageing equipment deserves respect. Independent local electricians can inspect the panel, check terminations and grounding, and explain findings plainly. For households in Santa Maria and Goleta, that safety-first conversation comes before any discussion of added capacity or future plans. A careful record of what each circuit serves, kept after the visit in Santa Barbara, makes every future project in that home simpler. For households in Santa Maria, Santa Barbara and across Santa Barbara, the practical next step is an assessment by independent local electricians who can relate the work to a Santa Barbara home built in the 1970s and to the loads it carries today.
Census figures for Santa Barbara count 97,138 homes built before 1980 and 37,385 built before 1960, out of 159,766 housing units in total. That is the local context for panel work in Santa Barbara: a large share of panels were sized for earlier demand. Independent local electricians can compare a home's existing service in Santa Barbara, California against that stock profile and its present loads.
In Santa Barbara, the distance from panel to garage and the panel's spare capacity shape every charging installation. Local electricians serving Santa Maria and Santa Barbara can measure both and explain your options.
In Santa Barbara, a repeatedly tripping breaker deserves an inspection, not repeated resets. VoltReach USA connects homeowners with independent local electricians who test the circuit and explain the cause clearly.
Standby generators in Santa Barbara, California start automatically during outages, protecting heat, food, and pumps in Santa Barbara homes. VoltReach USA connects homeowners with independent local electricians who plan and install these systems.
Storms and switching send spikes through Santa Barbara, California wiring. VoltReach USA refers homeowners to independent local electricians who explain panel protection and how it layers with plug-in devices.
Outdoor and indoor lighting projects in Santa Barbara start with how each space is used. Homeowners across 1 counties use VoltReach USA to reach independent local electricians for lighting installation and planning.
Ceiling fans in Santa Barbara, California make rooms feel cooler through 1.0 hot days and return warm air in winter. VoltReach USA connects homeowners with independent local electricians who install fans on properly braced ceiling boxes.
Need more outlets or GFCI protection in Santa Barbara, California? VoltReach USA refers homeowners to independent local electricians who plan device work around your rooms and circuits.
CO coverage matters in Santa Barbara, California homes with fuel-burning appliances or attached garages. VoltReach USA refers you to an independent local electrician to place alarms near sleeping areas.
New equipment or a refit coming up in Santa Barbara, California? VoltReach USA refers businesses to independent local electricians who can plan dedicated circuits and lighting around the layout.
Two patterns generate most of the bookings behind the services above: Aluminum Wiring in Santa Barbara Homes and heating load strain in Santa Barbara. That is why the order of this page's service list is what it is — the services answering those patterns come early, and the rest follow in the order the metro's data supports. A homeowner whose home matches the local profile — built in the metro's big decades, in one of its older districts — is, statistically, reading their own shortlist.
From problem to fixed, in Santa Barbara
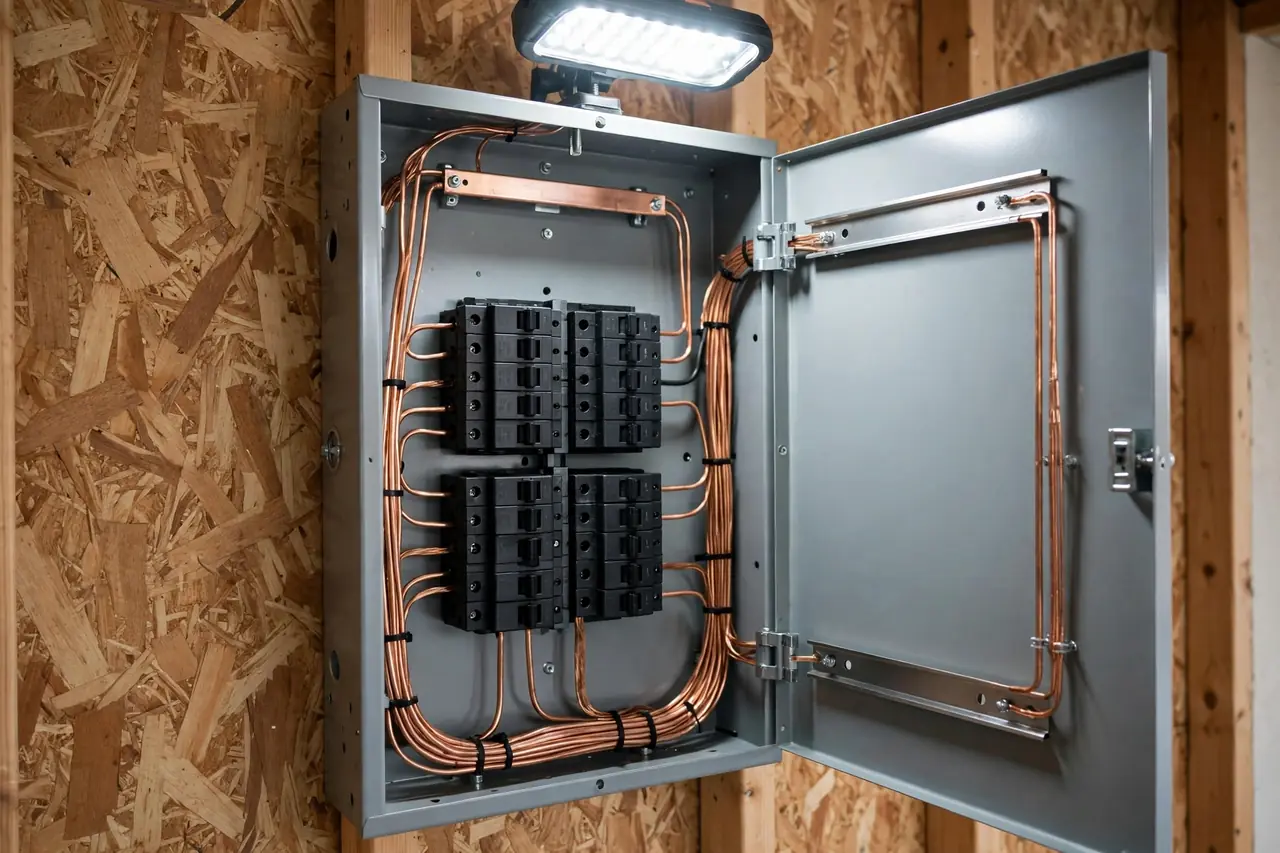
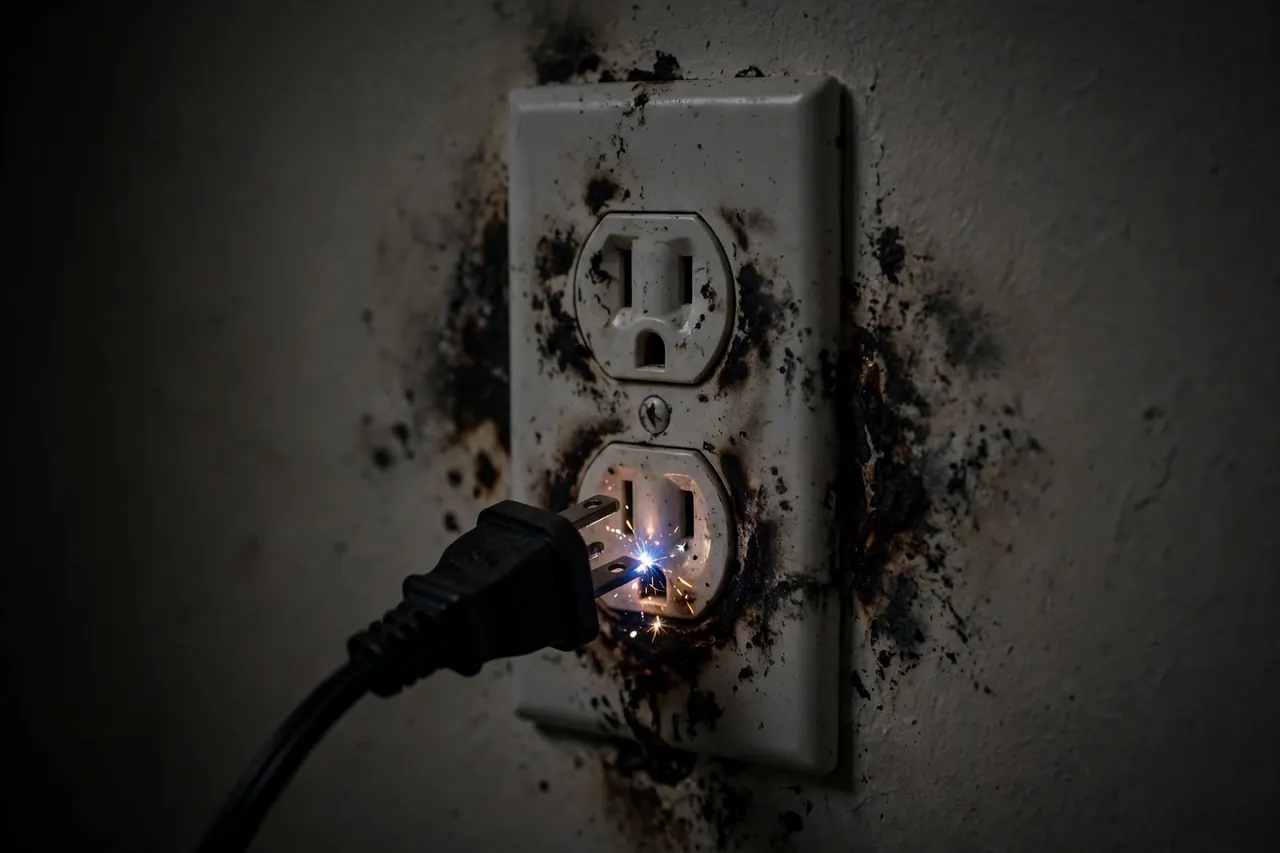
PROBLEMAn electrical problem inside a Santa Barbara home
➔
SOLUTIONThe same system in Santa Barbara after professional repair
Areas covered in the Santa Barbara metro
Santa Maria
Population 109,880
Santa Barbara
Population 88,024
Lompoc
Population 43,819
Goleta
Population 32,693
Orcutt
Population 31,284
Eastern Goleta Valley
Population 29,411
Isla Vista
Population 13,717
Carpinteria
Population 13,100
University of California-Santa Barbara
Population 11,634
Montecito
Population 8,823
Guadalupe
Population 8,422
Vandenberg Village
Population 6,793
Also in the Santa Barbara metro: Solvang (population 6,034), Buellton (population 5,090).
Beyond Santa Maria itself, the metro takes in Santa Barbara (88,024 residents), Lompoc (43,819) and the rest of the communities in the grid above — each wired in its own building era, which is why two streets in the same metro can need entirely different electrical conversations. The ZIP list below is the full coverage footprint: if your code is on it, this page was written about your housing stock.
Beyond the largest communities sit Goleta (32,693), Orcutt (31,284), Eastern Goleta Valley (29,411), Isla Vista (13,717), Carpinteria (13,100) — smaller places across Santa Barbara, covered on the same terms. Their housing tends to be older on average than the big suburbs', and their calls follow the older patterns on this page. One routing covers them all: find your ZIP code below and the rest is a phone call.
Every metro has a first city and a supporting cast, and the census figures draw the billing plainly here: Santa Maria first, with 109,880 residents; Santa Barbara second at 88,024; Lompoc third at 43,819; then the long tail of smaller communities in the grid above. The billing matters less than the building dates — each of these places was wired in its own decade, by its own builders — but between them they account for nearly every housing era, panel generation and failure pattern this page describes.
Administratively the metro is drawn from Santa Barbara — 1 in all — with Santa Barbara County at its centre. County lines do not change circuit physics, but they do shape the paperwork around the work: permits, inspections and code details are county and city business, which is one reason the professional who serves your street is a local one.
Three neighbouring coverage areas begin where this one ends: Oxnard–Ventura, CA, some 53 miles off; San Luis Obispo, CA, 63 miles; and Bakersfield, CA, 93 miles. Each keeps its own page because each keeps its own numbers — a different median build year, a different climate station, a different problem ranking. Boundary households should trust the ZIP list over the map: the code, not the compass, assigns the dataset.
Set Santa Barbara among its neighbours and the contrasts sharpen the profile: Oxnard–Ventura, CA — metro population 830,851, median build year 1977 — sits 53 miles away; San Luis Obispo, CA (282,367, median 1983) 63 miles; Bakersfield, CA (927,068, median 1984) 93 miles. Three different housing stocks under three nearby skies, which is why each keeps its own page and its own problem ranking rather than borrowing this one.
Count the metro per unit of itself: 6,657 housing units per covered ZIP code; 148,960 households per county; 14 communities sharing 1 county governments. Then weigh the generations against each other — 4.2 older homes for each newer one — and the service pattern on this page stops being a list and becomes a proportion: that much of the diary written by ageing systems, the rest by young ones wearing in.
Santa Barbara by the derived numbers — median home age 52 years · owners in 78,800 homes, renters in 70,160 · each covered ZIP code carrying about 1,558 pre-1960 homes · a heating-to-cooling degree-day ratio of 23.15 · 482 mm average annual rainfall.
Santa Barbara electrical questions
How can I tell whether VoltReach USA covers my Santa Barbara address?
Coverage on this page is defined in a plain, checkable way: if your ZIP code appears in the 24 codes listed for Santa Barbara, California, and your home sits inside Santa Barbara, you are inside the area this page was built for. VoltReach USA is a referral service, so coverage means the page can connect you with an independent local electrician who works in that territory, not that VoltReach itself sends a crew. Start by matching your code against the list, then check your county against Santa Barbara and the neighbouring counties named above. If both line up, use the contact route on this page and describe your panel, circuit or wiring concern in your own words. A second way to read the same boundary is through the communities it contains: Santa Maria with 109,880 residents, then Santa Barbara, Lompoc, Goleta and Orcutt, together account for much of the 443,975 population of the metro, and a home inside those communities and inside a listed code sits squarely within the territory this Santa Barbara page was researched and written to serve. For the record in its most compressed form, 93013, 93067, 93101, 93103 open the code list for Santa Barbara, the era ledger runs from 37,385 pre-1960 homes onward, and the largest community, Santa Maria, counts 109,880 residents within a metro population of 443,975 recorded for this page. Stated as a list of codes: the codes run 93013, 93067, 93101, 93103 and 93105 among the 24 on the list, spread over Santa Barbara. It is written for a metro whose largest places are Santa Maria (109,880 residents), Santa Barbara (88,024) and Lompoc (43,819). The housing ledger behind it counts 37,385 homes from before 1960 and 23,166 built since 2000 across the metro. Run the same ranking for nearby San Luis Obispo and its leading pattern is aluminum wiring - a different order from Santa Barbara's, which is why this site keeps a separate page for every metro. The footprint takes in Santa Barbara County - 1 covered county in all, each with its own page on this site. The coverage behind this answer spans ZIP codes 93013 through 93108 - the ZIP list published on this page.
Which homes in Santa Barbara need the closest eye on panels and wiring?
The homes that deserve the closest watch in Santa Barbara are the oldest ones, and the figures explain why. Some 23.4% of local homes were built before 1960 and 60.8% before 1980, which means a large share of the stock has lived through several generations of wiring, panel design and household demand. A panel fitted when a home ran a handful of circuits now often feeds kitchen appliances, laundry equipment, heating controls and electronics its makers never pictured. Watch older homes for breakers that trip under ordinary loads, warm outlet covers, flicker when large appliances start, and circuits that seem to carry a whole floor. Age alone is not a verdict, but it is the strongest prompt for a careful look. Geography sharpens that watch list across the Santa Barbara metro, because the oldest stock is not spread evenly: it concentrates in and around Santa Maria and the earlier-settled parts of Santa Barbara, while the places that grew later, among them Goleta and Orcutt, carry younger panels and wiring on average, so two streets with the same postal city can sit a generation apart electrically across the 24 codes and 1 counties this page covers. The ownership figures add a practical edge to the watch list, because with 52.9% of 148,960 households owning their homes in Santa Barbara, most of the older stock is looked after by the people living in it, and the panel and wiring decisions for 97,138 pre-1980 homes rest with those households directly, which makes an honest yearly watch a normal part of owning an older Santa Barbara home. The compressed watch list for Santa Barbara reads by numbers: codes from 93013 to 93103 contain districts where 37,385 pre-1960 homes and 59,752 homes from 1960 to 1979 cluster, while Santa Maria, at 109,880 residents, holds the densest share of the oldest wiring in the metro. For the watch list stated as codes: the codes run 93013, 93067, 93101, 93103 and 93105 among the 24 on the list, spread over Santa Barbara. The footprint takes in Santa Barbara County - 1 covered county in all, each with its own page on this site. The weather record behind it is SANTA BARBARA 11 W, CA US's: 2,498 heating degree-days against 108 cooling degree-days in an average year. Read it against a median build year of 1974 and a 60.8% share of homes from before 1980. Run the same ranking for nearby Hanford and its leading pattern is overloaded circuits - a different order from Santa Barbara's, which is why this site keeps a separate page for every metro. The housing ledger behind it counts 37,385 homes from before 1960 and 23,166 built since 2000 across the metro.
What electrical issue leads the list for Santa Barbara households?
The leading electrical problem in Santa Barbara homes is Aluminum Wiring in Santa Barbara Homes, with heating load strain in Santa Barbara next in line. That order is not a guess. It comes from reading the local housing eras together with the local climate record, because most household electrical faults grow out of that pairing: older panels and circuits carrying modern loads, season after season of heating and cooling demand, and wiring that has cycled between hot and cold for decades. You may recognise the leader in your own home as a breaker that trips when appliances combine, a circuit that gives up under a familiar load, or protection that reacts more often than it once did. The ranking tells you where to look first, not what your home has. Only an inspection of your own panel and circuits can say that. The third name on the podium, ageing panels in Santa Barbara, keeps the top two honest, because it shows the ranking is a genuine ordering rather than a single headline: each step down the podium corresponds to causes that are present in Santa Barbara but less widespread, whether measured by era share, by seasonal load at SANTA BARBARA 11 W, CA US, or by the share of homes whose panel and circuit layout exposes them to that particular failure pattern. The densest summary of why Aluminum Wiring in Santa Barbara Homes leads in Santa Barbara fits in one breath: 97,138 homes built before 1980, a median year of 1974, 18.98 of precipitation and a population of 443,975 whose daily demand lands on panels and wiring installed, in large part, for a lighter electrical age. With the leading problem stated against the era count: the era ledger reads 37,385 homes before 1960, 59,752 from 1960-1979, 39,462 from 1980-1999 and 23,166 since 2000 — 159,766 units, 148,960 households, 52.9% of them owner-occupied. The weather record behind it is SANTA BARBARA 11 W, CA US's: 2,498 heating degree-days against 108 cooling degree-days in an average year. Read it against a median build year of 1974 and a 60.8% share of homes from before 1980. The coverage behind this answer spans ZIP codes 93013 through 93108 - the ZIP list published on this page. The housing ledger behind it counts 37,385 homes from before 1960 and 23,166 built since 2000 across the metro. The footprint takes in Santa Barbara County - 1 covered county in all, each with its own page on this site.
What does the Santa Barbara climate do to panels, circuits and wiring?
Start with the numbers that govern demand in Santa Barbara: 2,498 heating degree days against 108 cooling degree days, an average temperature of 58.4, and 18.98 of precipitation in a typical year at SANTA BARBARA 11 W, CA US. The balance between those heating and cooling totals tells you which season leans hardest on your panel. A heating-led climate keeps furnace controls, supplemental heaters and freeze protection drawing for months. A cooling-led climate puts air conditioning at the centre of summer load, often alongside everything else a household runs in the evening. Either way, the busiest circuits are the ones to watch for trips and warmth at outlets. Weather sets the workload. The condition of your panel and wiring decides how gracefully that workload is carried. Read the SANTA BARBARA 11 W, CA US record as a metro average rather than a street forecast, because conditions in Santa Barbara vary between the built-up centre around Santa Maria, the communities of Santa Barbara and Lompoc, and the fringe areas near the county lines of Santa Barbara: elevation, tree cover and exposure differ, yet every part shares the same seasonal load swing, and it is that shared swing, acting on different ages of wiring, that produces such different electrical outcomes within one metro. The household numbers give the climate figures their human scale in Santa Barbara: 148,960 households experience the same 2,498 heating degree days and 108 cooling degree days through very different buildings, from pre-1960 homes with original circuit layouts to post-2000 homes built for present loads, so identical weather produces gentle service in one home and repeated breaker trips in the next, purely through the building it passes through. The station figures in their densest form for Santa Barbara are these: SANTA BARBARA 11 W, CA US records 58.4 on average, 1.0 days at the top of the heat range, 1.3 at freezing or below, and 18.98 of precipitation, numbers that between them govern load, cycling and moisture for every circuit in the metro. With the weather load stated against the codes: the codes run 93013, 93067, 93101, 93103 and 93105 among the 24 on the list, spread over Santa Barbara. Run the same ranking for nearby Los Angeles and its leading pattern is overloaded circuits - a different order from Santa Barbara's, which is why this site keeps a separate page for every metro. The housing ledger behind it counts 37,385 homes from before 1960 and 23,166 built since 2000 across the metro. All of it describes the Santa Maria–Santa Barbara metro as the Census defines it - 443,975 residents in 159,766 housing units. Read it against a median build year of 1974 and a 60.8% share of homes from before 1980. It is written for a metro whose largest places are Santa Maria (109,880 residents), Santa Barbara (88,024) and Lompoc (43,819).
What should I do first if I smell burning from an outlet or see sparks in the Santa Barbara metro?
A burning smell from an outlet means heat is being produced where it should not be, so the first steps are about removing load and removing people, not about fixing anything. Stop using the outlet and its circuit. Keep the area clear. Do not spray anything, do not touch the outlet face if it is warm or discoloured, and do not attempt to open it. Turning the breaker off is appropriate only if you can do it safely: dry conditions, an undamaged panel, no smoke or flame between you and it. If that safe route does not exist, leave the electrics alone and leave the home if the smell is strengthening. Emergency services handle fire and immediate danger. The utility handles lines and equipment outside the home. An independent electrician, reached through the connection on this page, handles the circuit once the danger has passed. If this happens in your Santa Barbara home, remember that help is organised locally: the coverage area on this page spans 24 ZIP codes across Santa Barbara, from Santa Maria to Orcutt, and the electrician you are connected with works in that same territory, so give your ZIP code and your community name when you make contact after the immediate danger has passed, because that detail routes your enquiry to the right part of the metro without delay. Once the immediate danger has passed, the details you pass on help more than you might expect: your ZIP code within the 24 listed for Santa Barbara, the room involved, whether water was anywhere nearby, and whether the breaker stayed off, together let the independent electrician arrive understanding the circuit's story, and in a metro of 148,960 households that clarity is what separates a focused first visit from a second one. In the compressed local record, incidents like this are read against 97,138 pre-1980 homes, a code list opening 93013, 93067, 93101, 93103, and a station history of 1.0 hot days loading older circuits hard, context that explains frequency without ever changing the safe first steps themselves. After an incident, stated for the record by era count: the era ledger reads 37,385 homes before 1960, 59,752 from 1960-1979, 39,462 from 1980-1999 and 23,166 since 2000 — 159,766 units, 148,960 households, 52.9% of them owner-occupied. The Census identity of this metro, Santa Maria–Santa Barbara with 443,975 residents, 52.9% owner-occupied and a median build year of 1974, explains why such incidents cluster in older circuits here compared with Oxnard–Ventura, CA at 53, San Luis Obispo, CA at 63 and Bakersfield, CA at 93: the podium faults Aluminum Wiring in Santa Barbara Homes, heating load strain in Santa Barbara and ageing panels in Santa Barbara all grow from the same ageing stock that makes conservative first steps so important locally. The code walk also helps the electrician who follows up in Santa Barbara: naming where in the sequence 93013, 93067, 93101, 93103, 93105, 93106, 93108 your home falls, together with the circuit involved and whether the breaker was left off, places the incident on the metro map at once, shortening the first conversation and letting the visit begin with the faulty circuit rather than with geography. The footprint takes in Santa Barbara County - 1 covered county in all, each with its own page on this site. The housing ledger behind it counts 37,385 homes from before 1960 and 23,166 built since 2000 across the metro. Read it against a median build year of 1974 and a 60.8% share of homes from before 1980. Run the same ranking for nearby Oxnard–Ventura and its leading pattern is aluminum wiring - a different order from Santa Barbara's, which is why this site keeps a separate page for every metro. It is written for a metro whose largest places are Santa Maria (109,880 residents), Santa Barbara (88,024) and Lompoc (43,819).
How do I know if my Santa Barbara home needs rewiring instead of a repair?
Judge the question the way an electrician does, by scope of cause. Local cause, local repair: a worn outlet, a failed breaker, a single damaged cable section. Systemic cause, wider answer: deteriorated insulation found in multiple locations, a wiring type known to need special handling at every connection, or circuits so altered over the years that their original layout no longer describes them. Santa Barbara has 97,138 homes built before 1980, so systemic causes are a routine finding rather than a rare one here. Partial renewal is also a real outcome; often only the oldest runs or the heaviest-use circuits need renewal while sound sections stay. That is why the assessment comes first. This page connects you with an independent electrician who can inspect, explain the pattern found, and recommend a scope that matches the evidence. The rewiring question lands differently across Santa Barbara depending on which ring of the metro a home occupies: the pre-1960 core around Santa Maria and the older streets of Santa Barbara produce the pattern cases most often, the 1960 to 1979 suburbs through Santa Barbara and Lompoc produce the material cases, and the newer ground toward Goleta and Orcutt produces mostly isolated repairs, a geography written by the 97,138 homes built before 1980 across 24 codes. Ownership sharpens the decision in practice, since 52.9% of Santa Barbara homes are owner-occupied and the household weighing repair against renewal usually owns the consequences either way: a repair that merely relocates a pattern fault will be paid for again in another room, while a renewal scoped to the faulty wiring generation settles the pattern, and that arithmetic, applied honestly by an inspecting electrician, is how most rewiring decisions in this metro are actually reached. Compressed, the renewal case in Santa Barbara rests on the ledger: 37,385 homes before 1960, 59,752 from 1960 to 1979, districts running from code 93013 to code 93103, and a largest community, Santa Maria, whose 109,880 residents live amid the oldest wiring generations in the metro. On renewal, stated by the communities in question: the community ledger reads Santa Maria (109,880 residents), Santa Barbara (88,024), Lompoc (43,819), Goleta (32,693) and Orcutt (31,284), out of 443,975 residents metro-wide. The weather record behind it is SANTA BARBARA 11 W, CA US's: 2,498 heating degree-days against 108 cooling degree-days in an average year. All of it describes the Santa Maria–Santa Barbara metro as the Census defines it - 443,975 residents in 159,766 housing units. The coverage behind this answer spans ZIP codes 93013 through 93108 - the ZIP list published on this page. The housing ledger behind it counts 37,385 homes from before 1960 and 23,166 built since 2000 across the metro. The footprint takes in Santa Barbara County - 1 covered county in all, each with its own page on this site. In Santa Barbara the 1960-1979 generation dominates (37.4% of homes), which is why this page's version of the check leans toward that era's failure modes before the newer ones.
Does VoltReach USA carry out the electrical work itself in the Santa Barbara metro?
Plainly: VoltReach USA does not do the work, does not quote the work as the attending firm, and does not send its own staff to homes in Santa Barbara. It is a referral service. Its contribution happens before and during your search: it assembles the local evidence on this page, from the 60.8% pre-1980 housing share to the seasonal load pattern, so you can describe your problem with useful context, and it routes your call to an independent local electrician. That electrician, a separate business, is wholly responsible for the visit and for anything done at your panel or on your circuits. You can ask them about their business, their findings and their proposed scope before agreeing to anything. That direct relationship between homeowner and electrician is exactly how the model is designed to work. Nothing about the model changes at the county line, which matters in a metro drawn as Santa Barbara with Santa Barbara at its centre: the research on this page covers the whole of that territory, the referral routes within the whole of it, and the work itself is done within it by independent electricians local to their part of Santa Barbara, so a reader in Santa Maria and a reader in Orcutt are using the same honest arrangement, described in the same words, with the same limits. A useful test of the model is to notice what this page never offers: it offers no arrival window of its own, no crew, no work carried out by the publisher, because VoltReach USA has none of those things to offer in Santa Barbara or anywhere else, and a referral service that is clear about that absence, while still doing the research thoroughly across Santa Barbara, is giving a homeowner exactly the two things it honestly can, evidence and a connection. The model in compressed form for Santa Barbara: one publisher maintaining research across codes 93013 to 93103 and the full list of 24, one metro of 443,975 residents including Santa Maria with 109,880, and independent electricians, separate from the publisher, doing every piece of work in every home the referral reaches. On who does the work, stated by the housing researched: the era ledger reads 37,385 homes before 1960, 59,752 from 1960-1979, 39,462 from 1980-1999 and 23,166 since 2000 — 159,766 units, 148,960 households, 52.9% of them owner-occupied. The coverage behind this answer spans ZIP codes 93013 through 93108 - the ZIP list published on this page. The weather record behind it is SANTA BARBARA 11 W, CA US's: 2,498 heating degree-days against 108 cooling degree-days in an average year. Run the same ranking for nearby Bakersfield and its leading pattern is overloaded circuits - a different order from Santa Barbara's, which is why this site keeps a separate page for every metro. It is written for a metro whose largest places are Santa Maria (109,880 residents), Santa Barbara (88,024) and Lompoc (43,819). All of it describes the Santa Maria–Santa Barbara metro as the Census defines it - 443,975 residents in 159,766 housing units.
What electrical checks should a Santa Barbara home get every year?
Once a year, work through the same short circuit of your Santa Barbara home. Start with protection: test every GFCI outlet using its own test and reset buttons, and note any that fail to trip or fail to reset, because a device that does not trip is not protecting anyone. Move to detectors: test each smoke and carbon monoxide detector, and check the date printed on it. Then the panel, from the outside only: look for discolouration, listen for buzzing, notice any breaker that feels warm compared with its neighbours, and exercise each breaker off and on. Finish outdoors: confirm exterior outlets have intact covers and test any outdoor GFCI. Everything on that list is observation and button-pressing, which is exactly where homeowner checks should stop. Panel internals, wiring condition and repeated breaker trips belong to an electrician. Carry that yearly walk through the whole geography of your own home the way this page covers the metro, from the centre to the edges: homes in the older parts of Santa Barbara, around Santa Maria and the early streets of Santa Barbara, earn extra attention on panel condition and outlet warmth, while homes in Goleta, Orcutt and the newer subdivisions across Santa Barbara earn the same detector, GFCI and outdoor-cover discipline, because protection checks matter in every one of the 24 codes equally. The yearly round earns its keep in proportion to the stock it serves: across 159,766 homes in Santa Barbara, with 97,138 built before 1960 alone, even a short list of button tests and visual checks, repeated annually by 148,960 households, surfaces failed protection and early heat signs at a scale no inspection programme could match, which is why the modest homeowner list on this page is treated as a serious layer of the metro's electrical safety. The yearly round in compressed form for Santa Barbara: test protection in the homes behind codes 93013, 93067, 93101, 93103, where the ledger counts 37,385 pre-1960 homes, and repeat it in the newest districts too, because detectors expire and outdoor covers age in Santa Maria, population 109,880, exactly as they do everywhere else. For the yearly round, stated by the housing it covers: the era ledger reads 37,385 homes before 1960, 59,752 from 1960-1979, 39,462 from 1980-1999 and 23,166 since 2000 — 159,766 units, 148,960 households, 52.9% of them owner-occupied. All of it describes the Santa Maria–Santa Barbara metro as the Census defines it - 443,975 residents in 159,766 housing units. The housing ledger behind it counts 37,385 homes from before 1960 and 23,166 built since 2000 across the metro. Read it against a median build year of 1974 and a 60.8% share of homes from before 1980. The coverage behind this answer spans ZIP codes 93013 through 93108 - the ZIP list published on this page. The footprint takes in Santa Barbara County - 1 covered county in all, each with its own page on this site. Start from the stock itself: 37.4% of Santa Barbara homes are 1960-1979 builds, the metro's dominant era, and the check is written for what that generation of wiring does as it ages.
How was this page's problem ranking worked out in the Santa Barbara metro?
Two datasets do most of the work. First, Census ACS housing data for the Santa Barbara metro: total units, the share in each era band, the median build year and the owner-occupied share. Those figures describe what is physically in the walls across 159,766 homes. Second, NOAA climate normals from SANTA BARBARA 11 W, CA US: the heating and cooling load, the count of very hot and freezing days, and the precipitation pattern. Those figures describe what the weather asks of those homes. Problems are scored per metro by matching each fault to the conditions that produce it, then ordering the scores. Panel capacity problems rise where older stock meets heavy seasonal load. Moisture-related faults rise where precipitation and outdoor exposure combine. No local call records are claimed and no invented figures are used. The ranking is an evidence-based ordering from housing and climate, and it is labelled that way. Because the inputs are metro-wide, the ranking describes Santa Barbara as a place rather than any single district within it: era shares spanning 37,385 pre-1960 homes to 23,166 built since 2000, read alongside the SANTA BARBARA 11 W, CA US climate record, produce one ordering for the whole territory of Santa Barbara, and local variation then does the rest, since a district dominated by one era will feel its era's problems more strongly than the metro ordering alone suggests to a reader in Santa Maria or Orcutt. The two sources also discipline each other usefully for Santa Barbara: the ACS prevents the ranking from drifting into weather generalities by anchoring it to counted homes in counted eras, 37,385 before 1960 through 23,166 since 2000, while the NOAA normals prevent it from drifting into pure housing commentary by anchoring it to measured load, 2,498 heating degree days against 108 cooling degree days at SANTA BARBARA 11 W, CA US. Strip the method to its tokens and it remains local: 93013, 93067, 93101, 93103 for place, 1974 for the median home, 23.4%, 37.4% and 24.7% for the era shape, and 58.4 with 18.98 for the climate, a set of figures no other metro on this site shares in exactly this combination. For the method, stated through its community evidence: the community ledger reads Santa Maria (109,880 residents), Santa Barbara (88,024), Lompoc (43,819), Goleta (32,693) and Orcutt (31,284), out of 443,975 residents metro-wide. Comparison with neighbouring metros is the method's own sanity check: Oxnard–Ventura, CA at 53, San Luis Obispo, CA at 63 and Bakersfield, CA at 93 were scored by the identical process, yet their podiums reorder Aluminum Wiring in Santa Barbara Homes, heating load strain in Santa Barbara and ageing panels in Santa Barbara differently, which is the expected result when one fixed method meets genuinely different housing eras and climates across a region rather than copying one city's answer onto the next. Walk the method by code and its local grounding shows street by street in Santa Barbara: the scoring that produced this ranking was applied to homes behind 93013, 93067, 93101, 93103, 93105, 93106 and 93108 alike, using the same era and climate inputs throughout, so no district in the list was favoured in the arithmetic and no district was left out of the evidence the ordering rests on. The footprint takes in Santa Barbara County - 1 covered county in all, each with its own page on this site. It is written for a metro whose largest places are Santa Maria (109,880 residents), Santa Barbara (88,024) and Lompoc (43,819). The coverage behind this answer spans ZIP codes 93013 through 93108 - the ZIP list published on this page. Read it against a median build year of 1974 and a 60.8% share of homes from before 1980. The housing ledger behind it counts 37,385 homes from before 1960 and 23,166 built since 2000 across the metro.
What wiring and panels should I expect in an older Santa Barbara home?
Picture Santa Barbara as rings of electrical history. At the centre, the pre-1960 core: the smallest original panels, the fewest original circuits, and wiring that has carried current through more heating and cooling seasons than any other stock in the metro. Around it, the 1960 to 1979 ring: larger homes, larger families of circuits, and the wiring types of a period when demand rose quickly. Beyond that, the 1980 to 1999 ring brought panels and protection nearer to current practice, and the post-2000 edge, 23,166 homes, started with present-day loads in mind. Systems in the oldest ring are not automatically failing; many have been renewed thoughtfully over the years. But the oldest ring is where original material survives longest, where alterations stack deepest, and where a careful system-wide look pays off most. Communities keep their electrical character for decades, which is why the oldest-home story in Santa Barbara is really several stories: the deep-core story in Santa Maria, the mid-century story across Santa Barbara and Lompoc, and the transition story in Goleta and Orcutt, where older farm-era or early-subdivision homes can sit among far newer builds, and where the 37,385 pre-1960 homes and 59,752 homes from 1960 to 1979 are scattered rather than concentrated, making house-by-house assessment the only reliable guide. Population helps date the rings as surely as architecture does in Santa Barbara: the long-settled weight of Santa Maria at 109,880 residents reflects the pre-1960 and mid-century building that still defines its streets, while the growth recorded in Goleta and Orcutt reflects later rings, so the community sizes quoted on this page and the era counts beside them are two readings of the same history of how the metro filled its 159,766 homes. The oldest-homes story compressed to its tokens for Santa Barbara: codes beginning 93013, 93067, 93101, 93103, an era ledger opening at 37,385 pre-1960 homes, a core community Santa Maria of 109,880 residents, and a median build year of 1974 that places half the metro's homes on the older side of the line. For the oldest homes, stated through their era count: the era ledger reads 37,385 homes before 1960, 59,752 from 1960-1979, 39,462 from 1980-1999 and 23,166 since 2000 — 159,766 units, 148,960 households, 52.9% of them owner-occupied. This metro's Census identity, Santa Maria–Santa Barbara with 443,975 residents, 52.9% owner-occupied and a median build year of 1974, frames its oldest districts against Oxnard–Ventura, CA at 53, San Luis Obispo, CA at 63 and Bakersfield, CA at 93: a lower median year means a deeper bench of old-core homes, more surviving early wiring, and more of the Aluminum Wiring in Santa Barbara Homes, heating load strain in Santa Barbara and ageing panels in Santa Barbara pattern that checks in those districts keep confirming. The housing ledger behind it counts 37,385 homes from before 1960 and 23,166 built since 2000 across the metro. The weather record behind it is SANTA BARBARA 11 W, CA US's: 2,498 heating degree-days against 108 cooling degree-days in an average year. All of it describes the Santa Maria–Santa Barbara metro as the Census defines it - 443,975 residents in 159,766 housing units. It is written for a metro whose largest places are Santa Maria (109,880 residents), Santa Barbara (88,024) and Lompoc (43,819). Run the same ranking for nearby Bakersfield and its leading pattern is overloaded circuits - a different order from Santa Barbara's, which is why this site keeps a separate page for every metro.
What should I expect an electrical check to find in a Santa Barbara home?
The findings repeat across Santa Barbara because the housing stock repeats its conditions. Breakers that trip under combined appliance loads are flagged where older panels meet modern kitchens and laundry rooms. GFCI outlets that have quietly failed, passing power while offering no protection, are flagged in bathrooms, kitchens and outdoor positions. Warm outlet faces and discoloured covers are flagged where connections have loosened over years of heat cycling. Panels reveal double-tapped breakers and circuits labelled so vaguely that no one can say what they feed. Detectors are found missing, expired or concentrated in one part of the home while sleeping areas go uncovered. None of these findings is exotic. Together they describe systems that grew by addition rather than by plan, which is the normal history of a home in a metro with a median build year of 1974. Expect the balance of those findings to shift as you move across Santa Barbara: checks in the older core around Santa Maria and Santa Barbara flag panel and wiring findings most heavily, checks through Santa Barbara and Lompoc flag a mix of load and protection findings, and checks toward Goleta and Orcutt flag proportionally more detector and outdoor findings, a spread that follows directly from the era map spread across 24 ZIP codes and 1 counties on this page. The podium problems and the check findings are two views of one reality in Santa Barbara: Aluminum Wiring in Santa Barbara Homes leads the ranking because the conditions behind it are what checks keep finding, and heating load strain in Santa Barbara follows in both lists for the same reason, so a homeowner who reads the ranking first and then hears similar findings at their own panel is watching the metro-level evidence and the house-level evidence agree, each lending the other credibility. The densest summary of the check walk uses the metro's own tokens: a median year of 1974, an era share of 60.8% before 1980, 1.0 hot days and 1.3 freezing days cycling the circuits, and 148,960 households whose panels, tested one by one, keep returning the same short list of findings. For check findings, stated against the housing checked: the era ledger reads 37,385 homes before 1960, 59,752 from 1960-1979, 39,462 from 1980-1999 and 23,166 since 2000 — 159,766 units, 148,960 households, 52.9% of them owner-occupied. Run the same ranking for nearby Oxnard–Ventura and its leading pattern is aluminum wiring - a different order from Santa Barbara's, which is why this site keeps a separate page for every metro. Read it against a median build year of 1974 and a 60.8% share of homes from before 1980. It is written for a metro whose largest places are Santa Maria (109,880 residents), Santa Barbara (88,024) and Lompoc (43,819). The coverage behind this answer spans ZIP codes 93013 through 93108 - the ZIP list published on this page. The weather record behind it is SANTA BARBARA 11 W, CA US's: 2,498 heating degree-days against 108 cooling degree-days in an average year. The local starting point is the dominant era - 1960-1979 homes are 37.4% of the stock here - so the findings above are read against that generation's panels and circuits first.
 PROBLEM
 SOLUTION