Everything on this page was computed for Buffalo and nowhere else: the problem ranking from its Census housing profile, the seasonal risks from its NOAA station record, the coverage from its own ZIP codes. VoltReach USA connects you to an independent local electrician; the page itself is the homework, done in public, so the call you make is an informed one.
88
ZIP codes covered
2
Counties in the metro
500,204
Households (Census ACS)
1957
Median year home built
Buffalo, NY — electrical help across the metroLocal electricians serving Buffalo neighbourhoodsPanel calls follow the housing eras in Buffalo
Buffalo electrical work, in brief
The median Buffalo home was built in 1957; 76.8% of the stock predates 1980, and the pattern this metro's own data ranks first is heating load strain in buffalo. VoltReach USA is a referral service, not an electrical company: one call connects you with an independent local electrician serving your ZIP code.
The Buffalo housing stock, and what it means for wiring
Start with the raw material: 1,161,385 people, 540,322 housing units, and a housing stock whose middle home was built in 1957. That single date organises everything on this page. On one side of it stand the older districts — 55.5% of homes predate 1960, 76.8% predate 1980 — wired in the generations before modern loads existed, in homes across Erie, Niagara that have been repaired piecemeal for decades. On the other side, the 9.4% built since 2000 carry 200-amp panels and grounded wiring throughout, and age in the newer ways. An Buffalo electrician reads a home's build year the way a doctor reads a chart: it predicts, before a single cover is opened, which systems deserve suspicion first.
Stand in one of Buffalo's older neighbourhoods and you are standing in its wiring's back catalogue. The homes there — part of the 414,967 built before 1980 across this metro — went up when a 60- or 100-amp panel was generous, a kitchen might have two circuits, and grounding was a rumour in half the rooms. Those budgets have now been spent many times over by modern loads. What it leaves behind is not universal failure but universal exposure: every panel, breaker and connection in those districts is operating past the horizon its makers planned for, in Erie County and beyond, and the failures arrive in the order the components tire.
The newer homes also house much of the metro's renting population, and rented electrical systems live a harder life: more devices per circuit in many cases, faults reported later, and maintenance decided by someone who does not live with the flicker. Across Buffalo, 500,204 households depend on systems most of them did not choose, and the post-2000 stock — 50,790 homes — is where the tenancy share runs highest. The failures are the modern ones: worn breakers, tired detectors, overloaded kitchen circuits. They arrive on the subdivisions' shared schedule regardless of who holds the lease.
The weather's part in this is written at BUFFALO, NY US, where an average year carries 40.68 inches of precipitation, 3.4 days at ninety degrees or more and 123.7 nights at freezing or below. Electrical systems experience that year as workload and as hazard in roughly equal measure — the workload in the HVAC load on the panel, the hazard in the storm seasons and the deep-freeze nights. The problem ranking further down is simply the housing profile above, read under this sky.
The Buffalo electrical profile in numbers
Two public records, one metro: what was built here, and what the sky does to it.
Lay the eras side by side instead: 55.5% pre-1960 (299,879 homes), 21.3% from 1960-1979 (115,089), 13.8% from 1980-1999 (74,564), and 9.4% since 2000 (50,790). No single era tells the story — the proportions among them do, and those proportions are different in every metro this site covers.
The defining fact about housing in Buffalo is how much of it predates 1960: 55.5 of the stock, 299,879 homes, with a median build year of 1957. Electrically, that era means fuse boxes or early small panels in some properties, service sizes of 60 to 100 amps, and in the earliest homes wiring methods such as knob-and-tube and cloth-insulated conductors that have now served for many decades. Ungrounded outlets are common findings. Across Buffalo, Cheektowaga and Tonawanda Town in Erie, the electrical profile of Buffalo, New York is therefore one of original systems, layered modifications and a real need for careful, era-aware assessment by independent local electricians. That inheritance also shapes decisions every week, from where a charger can go to whether a room can safely carry another heater through winter.
The second-largest band in Buffalo dates from 1960 to 1979, contributing many of the 115,089 mid-century homes found in Buffalo, Cheektowaga and Tonawanda Town. Its electrical character, early breaker panels, the aluminium wiring years and modest circuit counts, appears wherever this band fills in between older and newer districts in Erie. For Buffalo, New York, that means mid-century electrical questions, breaker condition, connection quality and capacity for modern loads, form a large share of everyday assessment work even in neighbourhoods whose dominant era is different at first glance. Terraces and ranches in Niagara Falls from this wave come up regularly when mid-century panels are opened for inspection.
Summer is the long electrical season in Buffalo. Across 3.4 days at or above 90 degrees and 608 cooling degree days at BUFFALO, NY US, air conditioning dominates demand from late morning to late evening in Buffalo, Cheektowaga and Niagara Falls, ceiling fans run for months and garages, where many panels live, reach their highest temperatures of the year. The 48.8 average understates those peaks, which is why afternoon tripping is such a familiar report across 500,204 households in Erie. Any honest profile of Buffalo, New York must treat that sustained heat load as a central fact of its electrical life. Garages, attics and exterior walls, where much equipment sits, experience the extremes most directly, which is why their condition features in almost every local assessment.
This ranking is where the two halves of the profile meet in Buffalo. Housing era alone does not decide a home's electrical condition, and climate alone does not either; it is their overlap, an older panel in Buffalo carrying peak summer load, or a mid-century circuit in Cheektowaga serving space heaters through freeze nights in Erie, that produces the findings homeowners actually face. Independent local electricians can place a specific Buffalo, New York home within this ranking and explain, from its era and its exposure, what deserves attention first.
Electrical problems Buffalo homes actually get
Selected and ranked from this metro's housing-age profile and climate record — not copied from another city's page.
Heating Load Strain in Buffalo
Heat pumps deserve a clear explanation for Buffalo homeowners, because their cold weather behaviour surprises many. In mild cold, a heat pump moves heat efficiently and draws moderately. As outdoor temperatures fall, its output drops just as the house needs more, and the system calls on auxiliary electric heat strips to close the gap. Those strips draw heavily, more like an electric furnace. A panel and circuit arrangement in Buffalo that handled the heat pump all autumn is suddenly feeding a much larger load in a cold snap. If breakers trip or rooms cool during the deepest cold in Cheektowaga or West Seneca, that transition — not a mysterious new fault — is often where the diagnosis begins.
Frozen building risks touch wiring indirectly in Buffalo, and a balanced page should place them correctly. The primary freeze threats are to plumbing, not conductors, but burst pipes and the water they release can reach outlets, panels and junction boxes in basements and crawl spaces in Tonawanda Town, and heating failures that cause freezes often begin with the electrical supply to the heating system. Keeping heating circuits sound is therefore freeze protection in a real sense for a Buffalo home. After any freeze event involving water inside the structure, electrical equipment the water reached should be inspected before being trusted, exactly as after a flood in Erie.
There is also a building condition thread in Buffalo worth naming. On the coldest nights, heating systems run without pause, and every connection in the heating circuit carries sustained current for many hours. Sustained current is what finds weak points: a loose termination in a disconnect in Tonawanda Town, a tired breaker in a panel in Niagara Falls, insulation on conductors aged by decades of heat cycles. A fault that smoulders electrically at low load declares itself at full load. That is why winter calls in Erie so often involve heating circuits and panels rather than lighting or outlets, and why a pre season check of heating circuits in Buffalo is worth more than the same check in spring.
Where does knob-and-tube typically remain in Buffalo houses? The pattern repeats: attic runs feeding ceiling lights, circuits inside walls that were never opened, and stretches in basements where later wiring was added alongside rather than in place of the original. Kitchens and bathrooms, having been remodelled, are often newer; spare bedrooms and hall lights often are not. That patchwork is why a whole house answer is rarely accurate. Independent local electricians trace circuits from the panel, identify which ones are still knob-and-tube, and note what each one feeds. A Buffalo homeowner then knows whether the remaining system serves two ceiling lights or half the house, a very different planning picture.
A practical caution belongs here for Buffalo homeowners: do not probe, move or test knob-and-tube wiring yourself, and be careful with stored items resting against old conductors in attics and basements. Brittle insulation can crack when disturbed, and conductors that look inert may be live. If insulation work, storage changes or a renovation will disturb areas where this wiring runs in a Buffalo home, have an electrician identify active runs first. That single sequencing step protects both the workers doing the later job and the wiring itself, and it takes little effort compared with repairing damage done in ignorance of what was hidden.
Insurance and renovation conversations are where many Buffalo homeowners first hear this term in a serious tone. An insurer, a home inspector or a renovation contractor in New York may ask whether knob-and-tube is present and active, and the homeowner may genuinely not know, because it hides above ceilings and behind plaster in Cheektowaga and West Seneca. This page makes no claim about any particular policy or rule, which vary and change. It makes a simpler point: knowing, with documentation, what wiring a Buffalo home actually contains is useful in every one of those conversations, and an electrician's assessment is how that knowledge is obtained.
Watch for
Home built before about 1950
Ceramic knobs and tubes visible in basement or attic
An electrical panel is the distribution point for every circuit in a Buffalo home, and its capacity sets a ceiling on how much the house can draw at once. Older 60 and 100 amp services in Buffalo were adequate when heating, cooking and hot water often came from other fuels and cooling was modest. Add central air, an electric range, a tumble dryer, a water heater and the small constant loads of modern electronics, and simultaneous demand can approach that ceiling on ordinary evenings. Tripping breakers, in that setting, are protective devices doing their job. Repeated trips point to a capacity and layout question that independent local electricians assess with a load calculation, not by fitting a larger breaker to an existing circuit.
Planning ahead softens most panel surprises in Buffalo. If a remodel, a charger, a heat pump or an addition is on the horizon in Buffalo or Cheektowaga, having the panel assessed at the planning stage gives the project a realistic sequence: service work first if it is needed, then the new circuit. It also gives a Buffalo homeowner time to compare explanations from independent local electricians and to understand permits and inspection steps that apply locally in New York. A panel decision made early, on inspection and calculation, is almost always calmer than one forced by a stalled installation or repeated trips.
Ask what changed in Buffalo homes and the answer is load, not age alone. A house in Cheektowaga or West Seneca built around 1957 might have started with gas heat, window fans and one television. Today the same address in Buffalo, New York may run air conditioning through 608 cooling degree days, plus an electric dryer, a dishwasher, computers and chargers on every counter. The original panel sits at the centre of that change. When breakers begin tripping as appliances overlap, that is often the first plain signal the service size and the present household no longer match.
A standby generator changes the outage experience in Buffalo in a way worth describing for homeowners weighing the option. Properly installed, it starts automatically when supply fails, carries a selected set of circuits — refrigeration, heating controls, lighting, medical or work essentials as chosen — and shuts down when grid power returns. The installation conversation covers sizing for those chosen loads, placement, fuel, and the transfer equipment that keeps the system isolated from the grid. It also covers maintenance, because a generator that is never exercised or serviced may not start on the night it is needed in Erie. An electrician can lay out those practicalities for a specific house in Buffalo before any decision is made.
If a service drop or meter equipment at a Buffalo home is damaged in a storm, the division of responsibility matters and confuses many homeowners. Some equipment belongs to the utility, some to the homeowner, and the boundary usually sits around the meter and service mast. An electrician can identify which parts are the homeowner's to repair and coordinate the sequence so utility reconnection happens once work passes inspection where required. Knowing that sequence in Buffalo prevents the frustration of arranging the wrong repair first. When in doubt after storm damage in Cheektowaga or West Seneca, ask an electrician to identify ownership of the damaged part before authorising any work.
Generators enter the Buffalo picture because outages here can outlast the food in a refrigerator and the patience of anyone working from home in West Seneca. After a major event, enquiries about generators spike across Erie, and with them a set of safety questions that deserve calm answers before the next storm rather than hurried ones during it. How a generator connects to a house — through a transfer switch or interlock arranged by an electrician, never by improvised cords — determines whether it powers selected circuits safely without endangering the household or line workers restoring supply in Buffalo. Planning that connection in fair weather is the pattern's practical lesson.
Freeze season in Buffalo is most clearly understood as a load season. Every house in Erie makes the same demands at once: heating at full stage, water heating recovering, cooking, laundry and lights, all while temperatures sit at their coldest. In homes among the 414,967 built before 1980 here, that combined peak can approach the service size for hours at a time. The practical responses are unglamorous and effective in Buffalo: stagger heavy loads where you can, give any space heater a circuit of its own, and treat repeated tripping in cold weather as a prompt for an electrician's assessment rather than a habit to live with until spring.
Deep cold in Buffalo exposes the difference between a heating system and a heating habit. The system may be sound while the habit, a space heater on an extension cord in a bedroom in Buffalo, a heated blanket and a hair dryer on one circuit in Cheektowaga, creates the overload. With 123.7 freezing days and substantial 6,466 at BUFFALO, NY US, those habits repeat nightly for weeks across 500,204 households in Erie. Independent local electricians can talk through safe heater use for a specific Buffalo, New York home, identify circuits with genuine headroom, and check the panel for signs of strain during freeze season.
A closer look: heating load strain in buffalo in Buffalo
Auxiliary heat is the hidden multiplier in Buffalo winter loads, and a closer look at it explains many midwinter surprises. Heat pump systems are commonly sized so the heat pump carries the load in moderate cold, with electric strips staged to assist in deeper cold and to temper air during defrost cycles. Each stage that engages adds a substantial, sustained draw. The homeowner experience in West Seneca or Cheektowaga is a system that behaved all through November and strains in the coldest week, drawing far more current in January than its nameplate habits suggested in autumn. An electrician evaluating winter trips in Buffalo will ask about the heating type and auxiliary arrangement early, check the circuits and breakers feeding each stage, and verify the panel can carry the combined household peak when all stages run. That combined peak — heating at full stage, water heating recovering, cooking underway — is the number the service must survive, and in many older Buffalo homes it has simply never been calculated.
Read the ranking backwards and it reads as a data summary: 1,161,385 residents in 540,322 housing units, 55.5% of the housing from before 1960, 40.68 inches of rain in an average year. The pattern leads because the exposure is broad — counted not in individual unlucky houses but in whole eras of the metro's building, stacked one on another.
The first visit follows a short, diagnostic list — each item ruling a branch of the problem in or out:
Look for discoloration along the heating path
Verify main breaker condition under load history
Check circuits in the coldest rooms for overload
Assess generator coverage for heating essentials
Examine panel for signs of sustained heat
Advise on load staggering during cold snaps
Electrical services in Buffalo
Sequenced by this metro's own problem ranking, not by a national catalogue order.
Emergency Electrician in Buffalo
Partial power loss in Buffalo, New York is usually a prompt repair rather than an emergency, unless heat, smell, sound, or water comes with it. VoltReach USA helps you describe the symptoms so the request reaches an independent local electrician.
Some electrical problems in Buffalo become urgent because of what the household depends on. Powered medical equipment, refrigerated medication, a well or sump system, remote work that cannot pause, or very young or elderly residents can turn a modest fault into a pressing one for a particular family in Erie. With 1,161,385 residents and 500,204 households, those circumstances are common and deserve to be stated plainly when seeking help. Independent local electricians can prioritise restoring the circuits a Buffalo household depends on most, once the situation is safe, and explain any temporary limitations honestly rather than promising a full restoration that conditions do not allow. Owners in Cheektowaga are advised to unplug sensitive electronics during a serious fault, protecting equipment while the cause is investigated. From Buffalo to the newer streets near Cheektowaga, the consistent advice in Buffalo is to understand the existing system first, and independent local electricians can provide that understanding for homes across 2 counties before any work is agreed.
Weather drives urgent calls in Buffalo: BUFFALO, NY US records 40.68 of precipitation, 3.4 hot days and 123.7 freezing days in a typical year. Storms, heat and cold each stress connections and equipment across 500,204 households in Buffalo. Independent local electricians can help a household establish whether a sudden problem lies within the home in Erie, Niagara or on the utility side of the service.
414,967 homes in the Buffalo area predate 1980, and many still carry wiring from the the 1950s period or earlier. A careful inspection in Erie shows which circuits are sound, which need attention first, and which can wait. That room-by-room map also makes it easier to line the work up with painting, flooring, or a kitchen project already planned for the coming year.
For rewiring, the safety case is made quietly by age alone in Buffalo. Homes counted in 414,967 built before 1980 may contain wiring types, junctions or modifications from several different decades, sometimes added by different hands over many years. Brittle insulation, ungrounded runs and overloaded circuits are not problems to guess at from the living room. Homeowners in Buffalo and Cheektowaga who notice warm outlets, frequent trips or unexplained flicker are usually advised to seek an evaluation promptly. Independent local electricians can test circuits, open accessible points for inspection in Buffalo, New York homes, and explain, without alarm, which sections merit priority on safety grounds alone. Keeping a clear record of renewed runs and junctions helps future work in Cheektowaga proceed without guesswork about what lies hidden. The 6,466 heating degree days and 608 cooling degree days recorded for Buffalo mean its homes work hard in both directions, so independent local electricians will usually ask about seasonal behaviour before recommending how a job in Buffalo should be approached.
In Buffalo, 21.3 of homes date from 1960 to 1979 and 55.5 from before 1960, together 414,967 homes whose wiring generations predate current expectations. Across 540,322 housing units in Erie, that makes wiring age a routine topic. Independent local electricians can identify which generation is present in a given Buffalo, New York home and where it remains in service.
With 414,967 homes in the Buffalo area built before 1980, many local panels predate central air, electric dryers, and home offices. VoltReach USA helps Buffalo homeowners connect with independent local electricians for an in-person panel evaluation. That in-person check also looks at grounding, the service cable, and how the household's heaviest appliances overlap during a normal busy evening at home.
Growth has split Buffalo into two electrical stories at once. In established districts around Buffalo, houses from earlier decades sit alongside newer subdivisions near Cheektowaga and Tonawanda Town, where 50,790 homes built since 2000, 9.4 of the stock, arrived with larger services as standard. That contrast matters across 2 counties and 88 ZIP codes. An older street may have one small panel after another, while a newer street a few miles away was built for far heavier loads. Homeowners weighing a panel upgrade in Buffalo, New York benefit from that neighbourhood context, and independent local electricians can place an individual home within it before any change is discussed in detail. Streets near Buffalo illustrate the point well, because neighbouring homes there can carry services fitted decades apart from one another. Across 88 ZIP codes in Buffalo, New York, homeowners who start with a clear evaluation, grounded in the age of the property and its 1957 era context, are well placed to decide what should happen now and what can be planned for later with independent local electricians.
At BUFFALO, NY US, Buffalo records 608 cooling degree days and 6,466 heating degree days, with 3.4 days at or above 90 degrees. Peak seasonal load is when panel capacity in Buffalo homes is tested hardest, especially in the 74,564 homes built from 1980 to 1999 whose panels are now decades old. Independent local electricians can factor that seasonal peak into an assessment.
Work-from-home routines across Buffalo depend on internet equipment, computers, and lighting staying live. A standby generator with an automatic transfer switch keeps a household in Niagara Falls running without refueling trips in bad weather. Restoring internet and a quiet place to work quickly turns an outage from a lost day into a minor interruption for many households now.
Generator safety in Buffalo deserves plain, direct language. Carbon monoxide risk from improper placement, backfeeding risk from improvised connections and the danger of running a portable unit in rain or in an enclosed space are serious hazards that no convenience justifies. A properly arranged transfer method keeps a home's system and the wider grid separated, protecting both the household and crews working nearby in Buffalo, New York. Independent local electricians can explain placement clearances, transfer equipment and safe operating steps for a specific property in Buffalo or Cheektowaga, and homeowners are encouraged to treat those safety elements as the core of the project, not as extras. Regular running and periodic checks, arranged for a Buffalo installation, keep the system ready for the outage that arrives without warning. With 76.8 of Buffalo homes built before 1980, experience of older systems matters locally, and independent local electricians who regularly work in Erie can explain the quirks of the 1950s construction without treating every older home as the same problem.
Housing age matters for generator placement in Buffalo: 414,967 homes built before 1980 and 74,564 built from 1980 to 1999 present varied panel locations and lot layouts across 88 ZIP codes. Independent local electricians can survey a Buffalo property in Erie, note panel configuration and clearances, and explain how transfer arrangements would fit that particular home rather than a generic layout.
In Buffalo, a repeatedly tripping breaker deserves an inspection, not repeated resets. VoltReach USA connects homeowners with independent local electricians who test the circuit and explain the cause clearly.
EV drivers in Buffalo, New York charge fastest at home with a dedicated Level 2 circuit. VoltReach USA connects homeowners in Erie with independent local electricians who assess panels and parking layouts in person.
Lost electronics to a surge in Buffalo? VoltReach USA connects you with an independent local electrician who can inspect your panel and explain realistic protection for the whole house.
Good lighting in Buffalo, New York layers ambient, task, and accent light instead of relying on one ceiling fixture. VoltReach USA connects homeowners with independent local electricians who plan and install lighting in Erie.
Ceiling fans in Buffalo, New York make rooms feel cooler through 3.4 hot days and return warm air in winter. VoltReach USA connects homeowners with independent local electricians who install fans on properly braced ceiling boxes.
Switch and outlet upgrades in Buffalo homes built around 1957 start with an in-person look. VoltReach USA connects you with an independent local electrician to plan the work.
CO coverage matters in Buffalo, New York homes with fuel-burning appliances or attached garages. VoltReach USA refers you to an independent local electrician to place alarms near sleeping areas.
Recurring trips or lighting failures in Buffalo premises deserve a whole-site assessment. VoltReach USA connects you with an independent local electrician who explains findings in plain language.
Two patterns generate most of the bookings behind the services above: Heating Load Strain in Buffalo and knob-and-tube wiring in Buffalo. That is why the order of this page's service list is what it is — the services answering those patterns come early, and the rest follow in the order the metro's data supports. A homeowner whose home matches the local profile — built in the metro's big decades, in one of its older districts — is, statistically, reading their own shortlist.
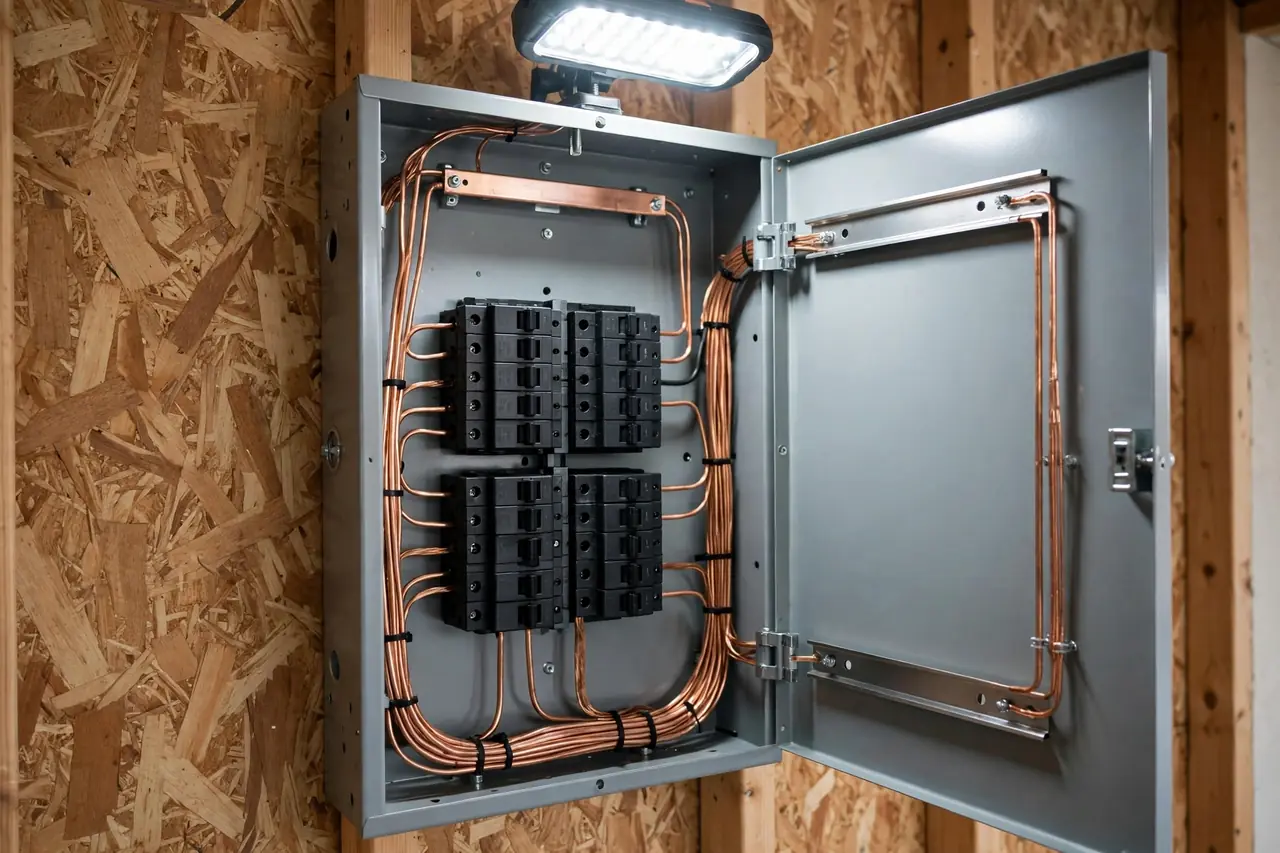
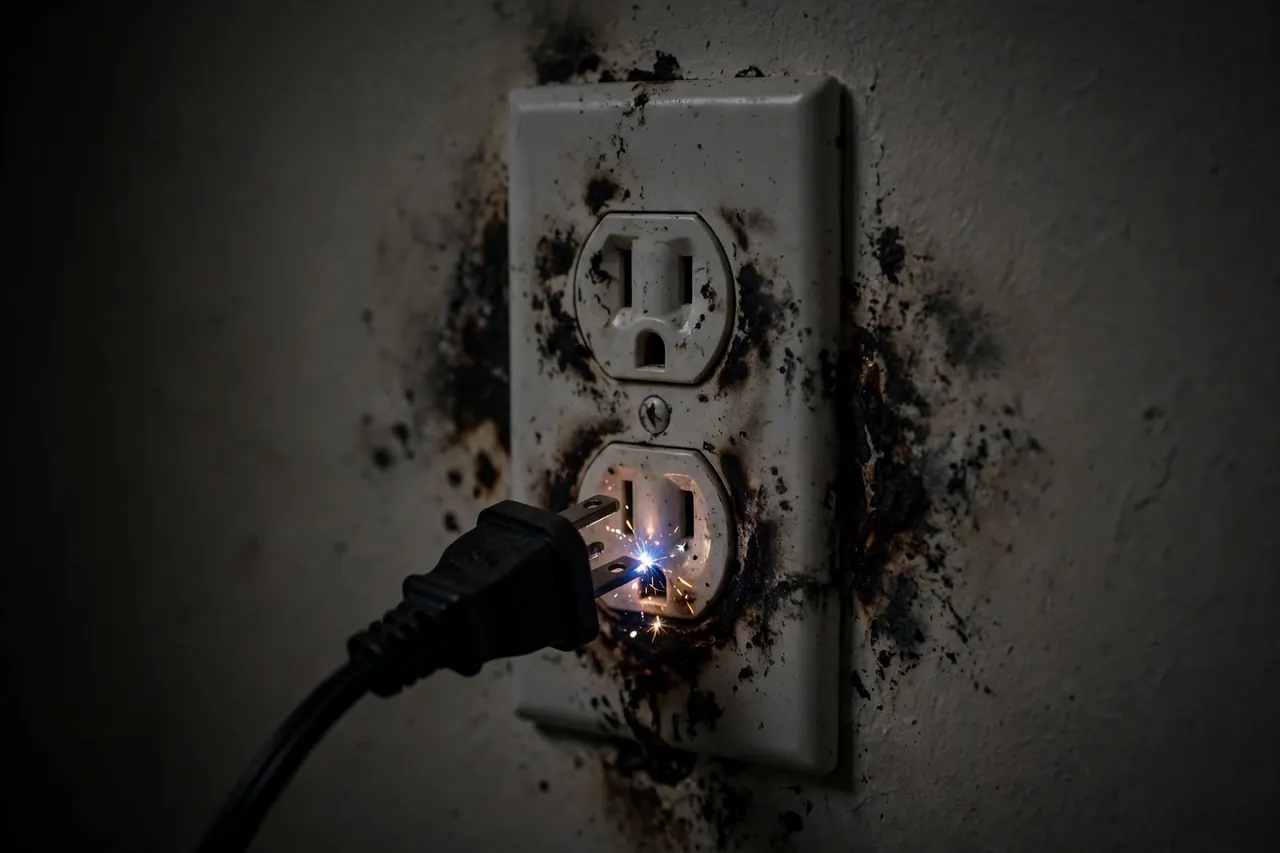
From problem to fixed, in Buffalo
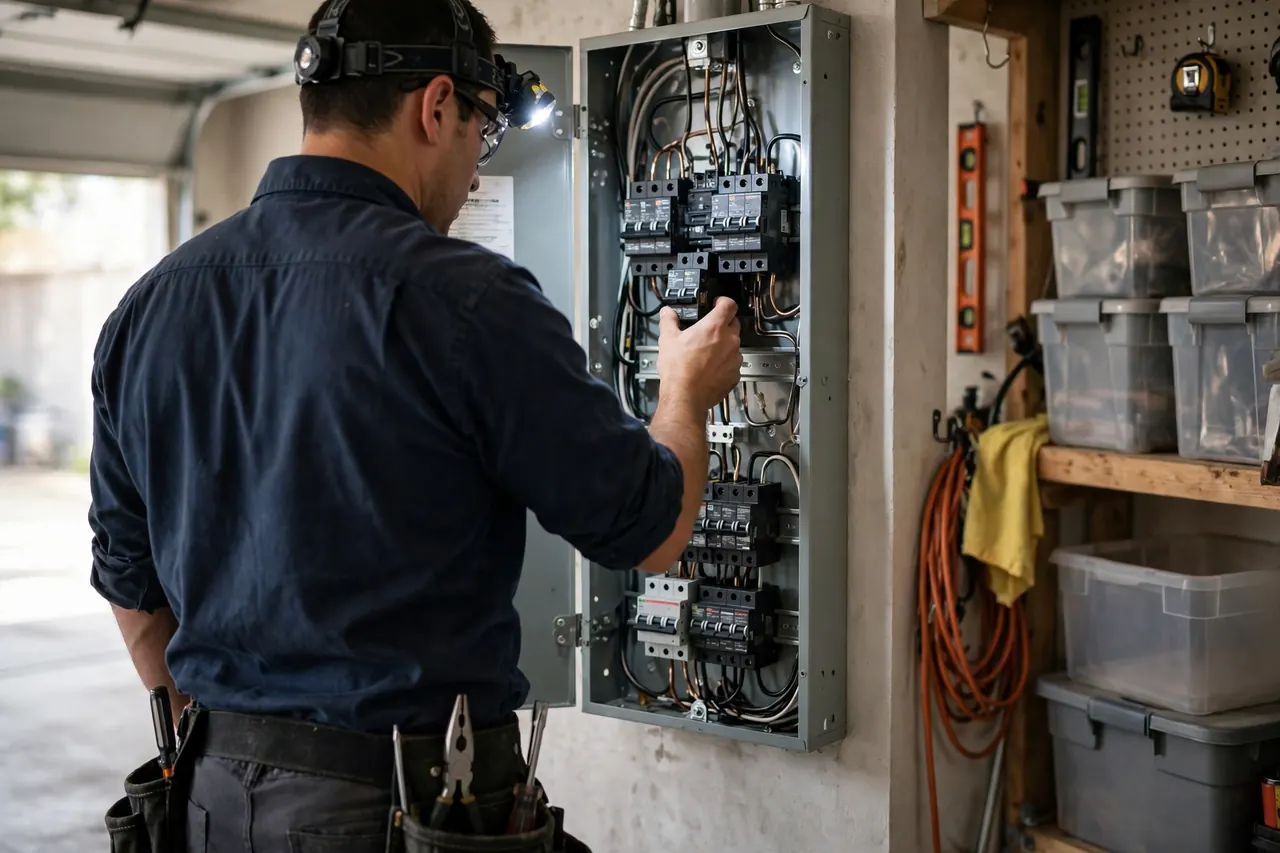
PROBLEMAn electrical problem inside a Buffalo home
➔
SOLUTIONThe same system in Buffalo after professional repair
Areas covered in the Buffalo metro
Buffalo
Population 276,397
Cheektowaga
Population 76,251
Tonawanda Town
Population 56,973
Niagara Falls
Population 48,198
West Seneca
Population 45,329
North Tonawanda
Population 30,338
Lockport
Population 20,699
Lackawanna
Population 19,779
Eggertsville
Population 15,416
Kenmore
Population 15,097
Depew
Population 15,065
Tonawanda
Population 15,044
Also in the Buffalo metro: Lancaster (population 10,127), Hamburg (population 9,762).
The communities in the grid are not suburbs of the page; they are its subject as much as Buffalo is. Cheektowaga (76,251 residents) and Tonawanda Town (56,973) carry their own building decades, their own panel generations and their own positions in the problem ranking's logic — a circuit under a Cheektowaga street answers to the same data as one in the centre, but to a different era of it. Coverage here is defined by the ZIP list below; understanding is defined street by street, and this page's figures are the metro-wide version of a story each community tells in its own numbers.
Also on the Buffalo map: Niagara Falls (48,198), West Seneca (45,329), North Tonawanda (30,338), Lockport (20,699), Lackawanna (19,779) — communities spread across Erie, Niagara, each with housing from its own growth years. An electrician routed through VoltReach USA to any of them is working from this same page: the metro data does not change at the city limit, but the housing on your street — its age, its wiring, its panel — is what the visit is really about.
Start with Buffalo itself: 276,397 residents, 23.8% of the metro — the centre the rest of the map orbits. Cheektowaga (76,251) and Tonawanda Town (56,973) form the next ring out, housing with its own building decades and its own wiring generations. Beyond them the metro thins into the smaller communities in the grid above, each a few thousand households deep — small in population, identical in one respect: their circuits answer to the same eras and the same weather as the big city's.
One metro, 2 county lines drawn through it: Erie, Niagara. The lines are invisible to the current and the weather, but they structure everything administrative around an electrical job — which office permits it, which inspector signs it, which code edition applies. Erie County, at the centre, carries the oldest housing and the heaviest share of the work this page describes; its neighbours carry the growth. A routed local electrician navigates the patchwork so the homeowner does not have to.
Beyond the metro line, the nearest covered metros are Rochester, NY (60 miles away), Syracuse, NY (140 miles) and Binghamton, NY (151 miles) — separate pages, separate profiles, because their housing and weather records are their own. Homeowners near the boundary sit between two datasets; the ZIP list above, not the map's edge, decides which page was written about your stock.
The region around Buffalo is a set of variations on its theme: Rochester, NY, 60 miles off, runs a median build year of 1966 on a metro population of 1,056,149; Syracuse, NY (140 miles) medians 1964 on 652,273; Binghamton, NY (151 miles) medians 1960 on 243,189. Nearness is not sameness — a few decades of median build year separate their wiring as surely as the miles separate their maps.
The stock has a shape as well as a size. Owners hold 66.5% of it and renters 33.5%, a split that decides who notices a flicker first and who arranges the repair. The generations split 8.2-to-one in favour of the pre-1980 homes. And the map divides into 14 named communities across Erie, Niagara, each carrying its era's share of the 540,322 housing units the Census counts here.
The Buffalo record in one line — median home age: 69 years · owner-occupied homes: 332,636 · renter-occupied homes: 167,568 · pre-1960 homes per covered ZIP code: 3,408 · heating-to-cooling degree-day ratio: 10.64 · average rainfall: 1,033 mm a year.
Buffalo electrical questions
Is my neighbourhood in Buffalo inside the VoltReach USA coverage area?
This page covers the part of Buffalo described by its own ZIP and county lists, and nothing vaguer than that. The lists name 88 codes and the counties collected as Erie, Niagara. Homes in Buffalo and the other communities profiled on this page sit inside that same defined area. If you live just beyond a listed code, treat this page as background reading rather than as your connection route, because the electrician network behind it is organised around those codes. VoltReach USA does not do the electrical work itself. Its role is to publish clear local information and to connect a homeowner in the covered area with an independent electrician nearby. The population behind the boundary underlines its scale: 500,204 households in 540,322 homes across Erie, Niagara, with 66.5% owner-occupied, means the coverage list is not a token gesture toward Buffalo but a working map of where local homeowners actually live, street by street and code by code, throughout the metro this page describes in its housing and weather research above. For the record in its most compressed form, 14001, 14004, 14006, 14008 open the code list for Buffalo, the era ledger runs from 299,879 pre-1960 homes onward, and the largest community, Buffalo, counts 276,397 residents within a metro population of 1,161,385 recorded for this page. Stated as a housing count behind those codes: the era ledger reads 299,879 homes before 1960, 115,089 from 1960-1979, 74,564 from 1980-1999 and 50,790 since 2000 — 540,322 units, 500,204 households, 66.5% of them owner-occupied. Read it against a median build year of 1957 and a 76.8% share of homes from before 1980. The weather record behind it is BUFFALO, NY US's: 6,466 heating degree-days against 608 cooling degree-days in an average year. Run the same ranking for nearby Rochester and its leading pattern is heating load strain - a different order from Buffalo's, which is why this site keeps a separate page for every metro. All of it describes the Buffalo–Cheektowaga metro as the Census defines it - 1,161,385 residents in 540,322 housing units. The coverage behind this answer spans ZIP codes 14001 through 14026 - the ZIP list published on this page.
Does the age of my Buffalo home change how closely I should watch its electrics?
Age sorts Buffalo homes into a clear order of attention. Pre-1960 homes come first: their panels, circuit layouts and wiring insulation were specified for a different household, and decades of heat cycles inside walls and ceilings take a gradual toll. Homes from 1960 to 1979 follow closely, particularly where original wiring still serves rooms whose use has changed completely. Homes from 1980 to 1999, at 13.8% of the stock, generally started with more circuits and more panel capacity, yet they are now old enough for breakers, outlets and outdoor fittings to show wear. Homes built since 2000 began closest to present demand. Wherever your home sits, repeated small symptoms in an older system deserve more weight than the same symptom once in a newer one. Geography sharpens that watch list across the Buffalo metro, because the oldest stock is not spread evenly: it concentrates in and around Buffalo and the earlier-settled parts of Erie, while the places that grew later, among them Niagara Falls and West Seneca, carry younger panels and wiring on average, so two streets with the same postal city can sit a generation apart electrically across the 88 codes and 2 counties this page covers. Scale matters here as well: a metro of 1,161,385 residents in 540,322 homes where the median build year is 1957 cannot treat older-system watchfulness as a niche concern, since the pre-1980 share touches whole districts at once, and the households in those districts share not only an era of construction but the same generation of panels, circuits and wiring decisions made when their streets were first built. The compressed watch list for Buffalo reads by numbers: codes from 14001 to 14008 contain districts where 299,879 pre-1960 homes and 115,089 homes from 1960 to 1979 cluster, while Buffalo, at 276,397 residents, holds the densest share of the oldest wiring in the metro. For the watch list stated by community: the community ledger reads Buffalo (276,397 residents), Cheektowaga (76,251), Tonawanda Town (56,973), Niagara Falls (48,198) and West Seneca (45,329), out of 1,161,385 residents metro-wide. The coverage behind this answer spans ZIP codes 14001 through 14026 - the ZIP list published on this page. It is written for a metro whose largest places are Buffalo (276,397 residents), Cheektowaga (76,251) and Tonawanda Town (56,973). The housing ledger behind it counts 299,879 homes from before 1960 and 50,790 built since 2000 across the metro. The footprint takes in Erie County and Niagara County - 2 covered counties in all, each with its own page on this site. All of it describes the Buffalo–Cheektowaga metro as the Census defines it - 1,161,385 residents in 540,322 housing units.
What electrical issue leads the list for Buffalo households?
The most common problem identified for Buffalo is Heating Load Strain in Buffalo, and the runner-up is knob-and-tube wiring in Buffalo. Both make sense against the local backdrop. Homes around the median year of 1957 have panels and wiring that have served through many changes of ownership, appliances and room use, while the climate adds its own steady pressure through heating and cooling seasons. Electrical systems rarely announce decline all at once. They hint: a trip here, a flicker there, an outlet that works only sometimes. The leading problem is usually the hint that the largest number of local homes share. If your hints match it, say so plainly when you make contact, including when they happen and which circuit is involved. That detail shortens the path to a proper check. Put the leading problems against the ownership and era figures and the order steadies further: in a metro where 66.5% of homes are owner-occupied and 76.8% were built before 1980, the faults of ageing panels and circuits are not edge cases but the central experience of the stock, which is precisely the experience the ranking, led by Heating Load Strain in Buffalo and followed by knob-and-tube wiring in Buffalo, was assembled to describe for Buffalo. Behind the podium in compressed form: the code run 14001, 14004, 14006, 14008 spans districts built across every era in the ledger, Buffalo alone holds 276,397 residents, and the load figures at BUFFALO, NY US, 6,466 heating and 608 cooling degree days, keep the circuits behind Heating Load Strain in Buffalo working hard. With the leading problem stated by community: the community ledger reads Buffalo (276,397 residents), Cheektowaga (76,251), Tonawanda Town (56,973), Niagara Falls (48,198) and West Seneca (45,329), out of 1,161,385 residents metro-wide. Read it against a median build year of 1957 and a 76.8% share of homes from before 1980. All of it describes the Buffalo–Cheektowaga metro as the Census defines it - 1,161,385 residents in 540,322 housing units. The weather record behind it is BUFFALO, NY US's: 6,466 heating degree-days against 608 cooling degree-days in an average year. It is written for a metro whose largest places are Buffalo (276,397 residents), Cheektowaga (76,251) and Tonawanda Town (56,973). The housing ledger behind it counts 299,879 homes from before 1960 and 50,790 built since 2000 across the metro.
How does Buffalo's weather affect home electrical systems?
The climate in Buffalo shapes electrical wear in three practical ways. First, demand: with 3.4 days reaching the highest heat and 123.7 days dropping to freezing or below in the station record, homes swing between cooling load and heating load, and panels feel both swings. Second, cycling: wiring, breakers and connections expand and contract gently with temperature, and decades of that movement can loosen what began tight. Third, moisture and storms: heavy rain and wind test roof entries, outdoor circuits and overhead service lines. None of this means weather is the enemy of a well-kept system. It means the local pattern, measured at BUFFALO, NY US, should guide what you watch: load problems in peak season, moisture problems after storms. That weather story also changes across the metro itself, from the denser streets of Buffalo to the more open ground around Niagara Falls and West Seneca: exposed service lines, older outdoor fittings and long cooling or heating runs are distributed unevenly across Erie, Niagara, so a storm or a heat spell that barely troubles one part of Buffalo can be the event that exposes tired circuits and weathered outdoor outlets in another part of the same metro. The household numbers give the climate figures their human scale in Buffalo: 500,204 households experience the same 6,466 heating degree days and 608 cooling degree days through very different buildings, from pre-1960 homes with original circuit layouts to post-2000 homes built for present loads, so identical weather produces gentle service in one home and repeated breaker trips in the next, purely through the building it passes through. The station figures in their densest form for Buffalo are these: BUFFALO, NY US records 48.8 on average, 3.4 days at the top of the heat range, 123.7 at freezing or below, and 40.68 of precipitation, numbers that between them govern load, cycling and moisture for every circuit in the metro. With the weather load stated against the codes: the codes run 14001, 14004, 14006, 14008 and 14012 among the 88 on the list, spread over Erie, Niagara. Run the same ranking for nearby Binghamton and its leading pattern is heating load strain - a different order from Buffalo's, which is why this site keeps a separate page for every metro. All of it describes the Buffalo–Cheektowaga metro as the Census defines it - 1,161,385 residents in 540,322 housing units. The housing ledger behind it counts 299,879 homes from before 1960 and 50,790 built since 2000 across the metro. The coverage behind this answer spans ZIP codes 14001 through 14026 - the ZIP list published on this page. The weather record behind it is BUFFALO, NY US's: 6,466 heating degree-days against 608 cooling degree-days in an average year.
What should I do first if I smell burning from an outlet or see sparks in the Buffalo metro?
The order matters, so follow it in sequence. One: stop using the circuit and keep everyone away from the outlet. Two: unplug connected items only when it is clearly safe, with dry hands, a cool plug and no visible damage, and never by pulling a cord that is hot or smoking. Three: if it is safe to do so, turn that circuit off at the breaker and leave it off; skip this step entirely if there is water near the panel, if the panel itself smells of burning, or if reaching it means passing the problem. Four: if there is fire, heavy smoke, sparking that continues, or a downed line, leave the building and call emergency services, and call the utility for the line. VoltReach USA can then connect you with a local electrician for the inspection that follows. Do not reset the breaker repeatedly to test it. If this happens in your Buffalo home, remember that help is organised locally: the coverage area on this page spans 88 ZIP codes across Erie, Niagara, from Buffalo to West Seneca, and the electrician you are connected with works in that same territory, so give your ZIP code and your community name when you make contact after the immediate danger has passed, because that detail routes your enquiry to the right part of the metro without delay. Once the immediate danger has passed, the details you pass on help more than you might expect: your ZIP code within the 88 listed for Buffalo, the room involved, whether water was anywhere nearby, and whether the breaker stayed off, together let the independent electrician arrive understanding the circuit's story, and in a metro of 500,204 households that clarity is what separates a focused first visit from a second one. In the compressed local record, incidents like this are read against 414,967 pre-1980 homes, a code list opening 14001, 14004, 14006, 14008, and a station history of 3.4 hot days loading older circuits hard, context that explains frequency without ever changing the safe first steps themselves. After an incident, stated for the record by community: the community ledger reads Buffalo (276,397 residents), Cheektowaga (76,251), Tonawanda Town (56,973), Niagara Falls (48,198) and West Seneca (45,329), out of 1,161,385 residents metro-wide. The Census identity of this metro, Buffalo–Cheektowaga with 1,161,385 residents, 66.5% owner-occupied and a median build year of 1957, explains why such incidents cluster in older circuits here compared with Rochester, NY at 60, Syracuse, NY at 140 and Binghamton, NY at 151: the podium faults Heating Load Strain in Buffalo, knob-and-tube wiring in Buffalo and ageing panels in Buffalo all grow from the same ageing stock that makes conservative first steps so important locally. The code walk also helps the electrician who follows up in Buffalo: naming where in the sequence 14001, 14004, 14006, 14008, 14012, 14025, 14026 your home falls, together with the circuit involved and whether the breaker was left off, places the incident on the metro map at once, shortening the first conversation and letting the visit begin with the faulty circuit rather than with geography. Read it against a median build year of 1957 and a 76.8% share of homes from before 1980. The weather record behind it is BUFFALO, NY US's: 6,466 heating degree-days against 608 cooling degree-days in an average year. It is written for a metro whose largest places are Buffalo (276,397 residents), Cheektowaga (76,251) and Tonawanda Town (56,973). The housing ledger behind it counts 299,879 homes from before 1960 and 50,790 built since 2000 across the metro. The footprint takes in Erie County and Niagara County - 2 covered counties in all, each with its own page on this site.
When does a Buffalo home need rewiring rather than another repair?
Another repair makes sense while faults stay isolated and explicable. Rewiring becomes the honest option when the same story keeps repeating: the wiring generation in the walls is reaching the end of its serviceable life, and each repair simply moves the weakest point to the next section. Clues include repeated warm outlets on one wiring run, protection tripping without a new load to explain it, two-prong outlets throughout an older home, and evidence of many past alterations layered onto original circuits. In a metro where the median home dates to 1957, plenty of Buffalo houses sit exactly at this crossroads. An electrician making the call will look at the panel, test representative outlets and inspect accessible wiring runs before recommending a scope. Expect that reasoning, and ask for it, rather than accepting a recommendation without the inspection behind it. The rewiring question lands differently across Buffalo depending on which ring of the metro a home occupies: the pre-1960 core around Buffalo and the older streets of Erie produce the pattern cases most often, the 1960 to 1979 suburbs through Cheektowaga and Tonawanda Town produce the material cases, and the newer ground toward Niagara Falls and West Seneca produces mostly isolated repairs, a geography written by the 414,967 homes built before 1980 across 88 codes. The era percentages translate the rewiring judgement into local proportions for Buffalo: 21.3% of homes from 1960 to 1979 and 55.5% from before 1960 together form the pool where system-wide findings concentrate, while the 13.8% from 1980 to 1999 and the share built since 2000 produce them far less often, so the same fault history carries different weight depending on which slice of the local stock your home occupies. Compressed, the renewal case in Buffalo rests on the ledger: 299,879 homes before 1960, 115,089 from 1960 to 1979, districts running from code 14001 to code 14008, and a largest community, Buffalo, whose 276,397 residents live amid the oldest wiring generations in the metro. On renewal, stated against the era count in question: the era ledger reads 299,879 homes before 1960, 115,089 from 1960-1979, 74,564 from 1980-1999 and 50,790 since 2000 — 540,322 units, 500,204 households, 66.5% of them owner-occupied. The footprint takes in Erie County and Niagara County - 2 covered counties in all, each with its own page on this site. The housing ledger behind it counts 299,879 homes from before 1960 and 50,790 built since 2000 across the metro. The coverage behind this answer spans ZIP codes 14001 through 14026 - the ZIP list published on this page. Run the same ranking for nearby Kingston and its leading pattern is heating load strain - a different order from Buffalo's, which is why this site keeps a separate page for every metro. The weather record behind it is BUFFALO, NY US's: 6,466 heating degree-days against 608 cooling degree-days in an average year. In Buffalo the pre-1960 generation dominates (55.5% of homes), which is why this page's version of the check leans toward that era's failure modes before the newer ones.
Does VoltReach USA carry out the electrical work itself in the Buffalo metro?
It helps to picture two separate jobs. VoltReach USA does the publishing job: researching Buffalo housing stock across 540,322 homes, summarising the weather record, ranking common electrical problems and keeping the coverage list of 88 ZIP codes current. The independent local electrician does the household job: answering for the condition of your circuits, standing in front of your panel, and taking responsibility for any repair or renewal carried out at your address. VoltReach USA does neither the visiting nor the work, and it does not supervise the electrician at your home. That division is stated on this page because a homeowner deserves to know, before they call, exactly which organisation does which part. The referral exists to shorten your search for a local electrician, nothing more and nothing less. That division of roles holds in every community this page covers, from Buffalo through Cheektowaga, Tonawanda Town, Niagara Falls and West Seneca, across all 88 ZIP codes and 2 counties listed for Buffalo: VoltReach USA publishes and routes in each of them, and in each of them the attending work belongs to an independent local electrician, so the model a homeowner in the oldest core street meets is exactly the model a homeowner on the newest edge street meets. The scale of the publishing side is worth picturing: this one page summarises a metro of 1,161,385 residents, 540,322 homes and 88 ZIP codes for a reader deciding whom to contact, and that summary work, repeated across 300 city pages nationally, is the whole of what VoltReach USA does, while the whole of what happens inside a home in Buffalo belongs to the independent electrician the referral connects you with. Count the roles by their numbers and the distinction stays plain: VoltReach USA's side of Buffalo is counted in pages, codes and datasets, 88 codes and 540,322 homes researched, while the electrician's side is counted in visits, circuits tested and panels opened, and no figure from the first list ever appears on the second side of the ledger. On who does the work, stated by the housing researched: the era ledger reads 299,879 homes before 1960, 115,089 from 1960-1979, 74,564 from 1980-1999 and 50,790 since 2000 — 540,322 units, 500,204 households, 66.5% of them owner-occupied. The coverage behind this answer spans ZIP codes 14001 through 14026 - the ZIP list published on this page. The footprint takes in Erie County and Niagara County - 2 covered counties in all, each with its own page on this site. The weather record behind it is BUFFALO, NY US's: 6,466 heating degree-days against 608 cooling degree-days in an average year. Run the same ranking for nearby Binghamton and its leading pattern is heating load strain - a different order from Buffalo's, which is why this site keeps a separate page for every metro. It is written for a metro whose largest places are Buffalo (276,397 residents), Cheektowaga (76,251) and Tonawanda Town (56,973).
Which electrical checks should I do each year in my Buffalo home?
Build the yearly round around seasons in Buffalo, when heating or cooling load is working the system honestly. Press the test button on each GFCI outlet and confirm the reset restores it; replace nothing yourself beyond batteries in detectors that are designed for it. Test every detector in the home, including any near sleeping areas and utility spaces. At the panel, stay outside the cover: look for rust streaks, scorching or labels so faded the circuits cannot be identified, and switch breakers off and on to keep the mechanisms moving. Check outdoor outlets after wet weather for covers that no longer seal. If anything on the round fails, a GFCI that will not trip, a breaker that will not stay set, a warm outlet face, record it and stop there. Those findings are precisely the ones a professional visit exists to address. The checklist scales with the metro behind it: 540,322 homes across Erie, Niagara share the same short list of homeowner-safe checks, yet the findings those checks produce follow the age map, surfacing panel and wiring concerns more often in the older communities near Buffalo, Cheektowaga and Tonawanda Town, and surfacing mostly detector dates and outdoor-cover wear in the younger stock, so your street's era, within the Buffalo pattern of 76.8% built before 1980, predicts your likely findings. Timing the round to the local year helps it stick: many Buffalo households pair the checks with the turn into the heavy-load season their BUFFALO, NY US record implies, whether that is the cooling load of the 3.4 hottest days or the heating load across the 123.7 coldest, because testing GFCI protection and exercising breakers just before the system works hardest is when a failure found at the panel still leaves time to arrange a professional visit. Densest form: a stock profiled at 76.8% pre-1980, a station record of 123.7 freezing days and 3.4 hot days at BUFFALO, NY US, and 500,204 households each holding a short annual list of button tests and visual checks together amount to the metro's widest electrical safety net, provided the findings are handed onward. For the yearly round, stated by the communities it covers: the community ledger reads Buffalo (276,397 residents), Cheektowaga (76,251), Tonawanda Town (56,973), Niagara Falls (48,198) and West Seneca (45,329), out of 1,161,385 residents metro-wide. The footprint takes in Erie County and Niagara County - 2 covered counties in all, each with its own page on this site. All of it describes the Buffalo–Cheektowaga metro as the Census defines it - 1,161,385 residents in 540,322 housing units. The housing ledger behind it counts 299,879 homes from before 1960 and 50,790 built since 2000 across the metro. The weather record behind it is BUFFALO, NY US's: 6,466 heating degree-days against 608 cooling degree-days in an average year. The coverage behind this answer spans ZIP codes 14001 through 14026 - the ZIP list published on this page. The local starting point is the dominant era - pre-1960 homes are 55.5% of the stock here - so the findings above are read against that generation's panels and circuits first.
How did VoltReach USA rank the electrical problems for Buffalo?
Two datasets do most of the work. First, Census ACS housing data for the Buffalo metro: total units, the share in each era band, the median build year and the owner-occupied share. Those figures describe what is physically in the walls across 540,322 homes. Second, NOAA climate normals from BUFFALO, NY US: the heating and cooling load, the count of very hot and freezing days, and the precipitation pattern. Those figures describe what the weather asks of those homes. Problems are scored per metro by matching each fault to the conditions that produce it, then ordering the scores. Panel capacity problems rise where older stock meets heavy seasonal load. Moisture-related faults rise where precipitation and outdoor exposure combine. No local call records are claimed and no invented figures are used. The ranking is an evidence-based ordering from housing and climate, and it is labelled that way. The locality of the method shows in its geography as much as its arithmetic: the Census figures are drawn for the Buffalo–Cheektowaga as a whole and the weather figures from BUFFALO, NY US, the station serving Buffalo, so the ranking blends conditions across Buffalo, Cheektowaga, Tonawanda Town and every community in Erie, Niagara into one metro judgement, detailed enough to separate Buffalo from its neighbours, while honestly averaging across the 88 codes rather than pretending to street-level precision it does not have. The two sources also discipline each other usefully for Buffalo: the ACS prevents the ranking from drifting into weather generalities by anchoring it to counted homes in counted eras, 299,879 before 1960 through 50,790 since 2000, while the NOAA normals prevent it from drifting into pure housing commentary by anchoring it to measured load, 6,466 heating degree days against 608 cooling degree days at BUFFALO, NY US. The method in compressed form: Census era counts opening at 299,879 pre-1960 homes, NOAA figures from BUFFALO, NY US including 6,466 heating and 608 cooling degree days, applied across codes 14001 to 14008, in a metro whose largest community, Buffalo, counts 276,397 of its 1,161,385 residents. For the method, stated through its era evidence: the era ledger reads 299,879 homes before 1960, 115,089 from 1960-1979, 74,564 from 1980-1999 and 50,790 since 2000 — 540,322 units, 500,204 households, 66.5% of them owner-occupied. Comparison with neighbouring metros is the method's own sanity check: Rochester, NY at 60, Syracuse, NY at 140 and Binghamton, NY at 151 were scored by the identical process, yet their podiums reorder Heating Load Strain in Buffalo, knob-and-tube wiring in Buffalo and ageing panels in Buffalo differently, which is the expected result when one fixed method meets genuinely different housing eras and climates across a region rather than copying one city's answer onto the next. A second code-level reading underlines the same point for Buffalo: from 14001 at one end of the published list through 14004, 14006, 14008 and 14012 to 14025 and 14026 at the other, the homes counted in the Census inputs and the homes living under the BUFFALO, NY US climate inputs are the same homes, which is why the ranking can claim to describe the whole metro rather than a sampled corner of it. It is written for a metro whose largest places are Buffalo (276,397 residents), Cheektowaga (76,251) and Tonawanda Town (56,973). The weather record behind it is BUFFALO, NY US's: 6,466 heating degree-days against 608 cooling degree-days in an average year. The footprint takes in Erie County and Niagara County - 2 covered counties in all, each with its own page on this site. All of it describes the Buffalo–Cheektowaga metro as the Census defines it - 1,161,385 residents in 540,322 housing units. The housing ledger behind it counts 299,879 homes from before 1960 and 50,790 built since 2000 across the metro.
What wiring and panels should I expect in an older Buffalo home?
Expect variety, because oldest in Buffalo spans more than one electrical generation. Homes from before 1960, 55.5% of the stock, may carry original wiring in places, panels that have been partly renewed, and circuits added in waves as kitchens and bathrooms were modernised. Some retain two-prong outlets on older runs. Some have grounded circuits only where later work reached. The 1960 to 1979 stock around them, 21.3% of homes, typically started with more capacity yet includes wiring materials electricians inspect closely today. The practical point is that age alone does not describe a system. Two neighbouring pre-1960 homes can differ completely depending on what each owner renewed. That is why assessment in the oldest districts is always house by house, system by system, panel by panel. That ring pattern is visible on the ground across Buffalo: the pre-1960 fabric holds firmest around Buffalo and the earliest streets of Erie, the 1960 to 1979 fabric fills much of Cheektowaga and Tonawanda Town, and the later fabric spreads toward Niagara Falls and West Seneca near the edges of Erie, Niagara, so a drive across the metro, through its 88 codes, crosses the same sequence of panel sizes, circuit counts and wiring generations that the era ledger records in numbers. Population helps date the rings as surely as architecture does in Buffalo: the long-settled weight of Buffalo at 276,397 residents reflects the pre-1960 and mid-century building that still defines its streets, while the growth recorded in Niagara Falls and West Seneca reflects later rings, so the community sizes quoted on this page and the era counts beside them are two readings of the same history of how the metro filled its 540,322 homes. The oldest-homes story compressed to its tokens for Buffalo: codes beginning 14001, 14004, 14006, 14008, an era ledger opening at 299,879 pre-1960 homes, a core community Buffalo of 276,397 residents, and a median build year of 1957 that places half the metro's homes on the older side of the line. For the oldest homes, stated through their codes: the codes run 14001, 14004, 14006, 14008 and 14012 among the 88 on the list, spread over Erie, Niagara. This metro's Census identity, Buffalo–Cheektowaga with 1,161,385 residents, 66.5% owner-occupied and a median build year of 1957, frames its oldest districts against Rochester, NY at 60, Syracuse, NY at 140 and Binghamton, NY at 151: a lower median year means a deeper bench of old-core homes, more surviving early wiring, and more of the Heating Load Strain in Buffalo, knob-and-tube wiring in Buffalo and ageing panels in Buffalo pattern that checks in those districts keep confirming. It is written for a metro whose largest places are Buffalo (276,397 residents), Cheektowaga (76,251) and Tonawanda Town (56,973). The footprint takes in Erie County and Niagara County - 2 covered counties in all, each with its own page on this site. Run the same ranking for nearby Binghamton and its leading pattern is heating load strain - a different order from Buffalo's, which is why this site keeps a separate page for every metro. All of it describes the Buffalo–Cheektowaga metro as the Census defines it - 1,161,385 residents in 540,322 housing units. The coverage behind this answer spans ZIP codes 14001 through 14026 - the ZIP list published on this page.
What should I expect an electrical check to find in a Buffalo home?
Expect an electrician checking a Buffalo home to spend attention in proportion to risk, and expect the flags to sound familiar if you have read this page. Repeated breaker trips under ordinary combinations of appliances. GFCI protection that has failed silently in a wet location. Outlets or switches that run warm, or show heat discolouration. Breakers carrying two conductors where the design expects one, a common legacy of circuits added over the years. A panel whose capacity and layout strain against the demand of the home as it is lived in now, not as it was wired. Detector cover with gaps in the rooms that need it most. Each flag arrives with a reason and a remedy scope, and a homeowner is entitled to hear both explained plainly. A check that only lists faults without explaining consequence has done half its job. Expect the balance of those findings to shift as you move across Buffalo: checks in the older core around Buffalo and Erie flag panel and wiring findings most heavily, checks through Cheektowaga and Tonawanda Town flag a mix of load and protection findings, and checks toward Niagara Falls and West Seneca flag proportionally more detector and outdoor findings, a spread that follows directly from the era map spread across 88 ZIP codes and 2 counties on this page. Numbers frame how ordinary these findings are locally: in a stock of 540,322 homes where 76.8% predate 1980 and the median home dates to 1957, a check that flags a tired breaker, a failed GFCI device or a double-tapped terminal is describing the median experience rather than an unlucky one, and that framing matters, because it turns a list of faults from an accusation about one home into a maintenance agenda for a whole generation of Buffalo housing. Compressed, the check findings for Buffalo map onto the ledger without forcing: 414,967 pre-1980 homes behind codes 14001 to 14008, load figures of 6,466 heating and 608 cooling degree days at BUFFALO, NY US, and a core of 276,397 residents in Buffalo living in the stock where heat, protection and panel findings concentrate. For check findings, stated against the housing checked: the era ledger reads 299,879 homes before 1960, 115,089 from 1960-1979, 74,564 from 1980-1999 and 50,790 since 2000 — 540,322 units, 500,204 households, 66.5% of them owner-occupied. It is written for a metro whose largest places are Buffalo (276,397 residents), Cheektowaga (76,251) and Tonawanda Town (56,973). The housing ledger behind it counts 299,879 homes from before 1960 and 50,790 built since 2000 across the metro. Read it against a median build year of 1957 and a 76.8% share of homes from before 1980. All of it describes the Buffalo–Cheektowaga metro as the Census defines it - 1,161,385 residents in 540,322 housing units. The weather record behind it is BUFFALO, NY US's: 6,466 heating degree-days against 608 cooling degree-days in an average year. Start from the stock itself: 55.5% of Buffalo homes are pre-1960 builds, the metro's dominant era, and the check is written for what that generation of wiring does as it ages.
 PROBLEM
 SOLUTION